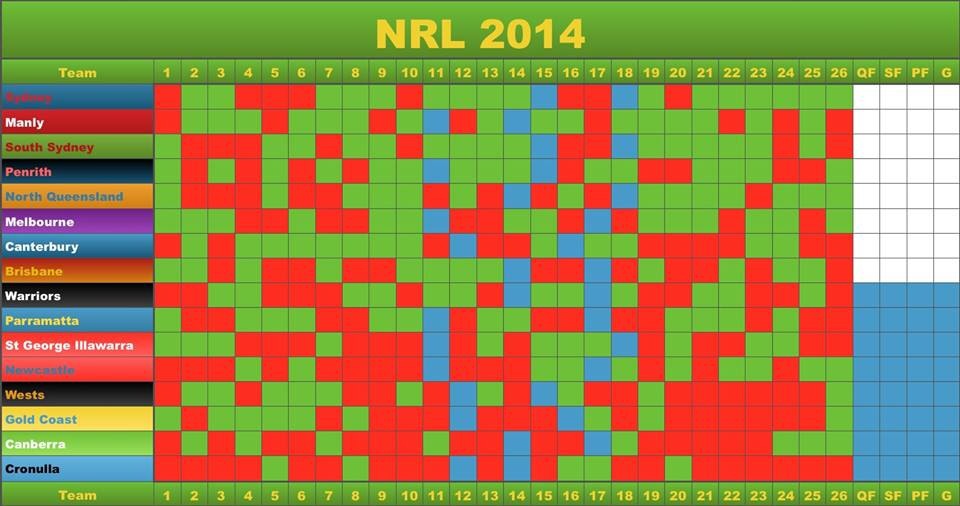
After 26 rounds the final series is upon us. 8 teams remain in the hunt to be crowned 2014 NRL champions. Since the conclusion of the bye period in round 18, the Sydney Roosters and North Queensland Cowboys have racked up 7 wins from 8 games, a spectacular run of form to take into the finals series. Souths and Melbourne have won 6 from 8, Manly have won 5 from 8, Penrith and Brisbane have won 4 from 8 and out of form Canterbury have only managed 2 wins from 8.
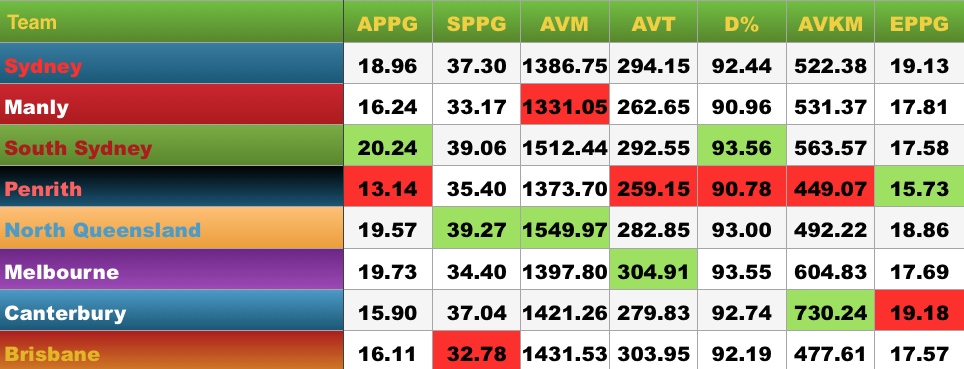
The Sydney Roosters swooped in under the radar and stole the minor premiership from Manly in the last round. Looking at this seasons collated statistics it is clear how they managed this. The Roosters finished the regular season with the most points (615), the best differential (230), most tackles (7384 at 307 per game), tries (106) and line breaks (137). They had the second highest success rate in defence (93.13%), just slightly behind Souths (93.83%) and produced the second most attacking plays per game (18.13 APPG), second only to the Warriors (18.58 APPG). South Sydney conceded the fewest points (361), missed the fewest tackles (465) and as stated above had the highest defensive success rate of any team in the regular season. They also produced 711 tackle breaks, the most of any team. The Cowboys finished the regular season with the most try assists (86), metres (35606 at 1483 per game), while Melbourne forced more drop outs then any other team (50)
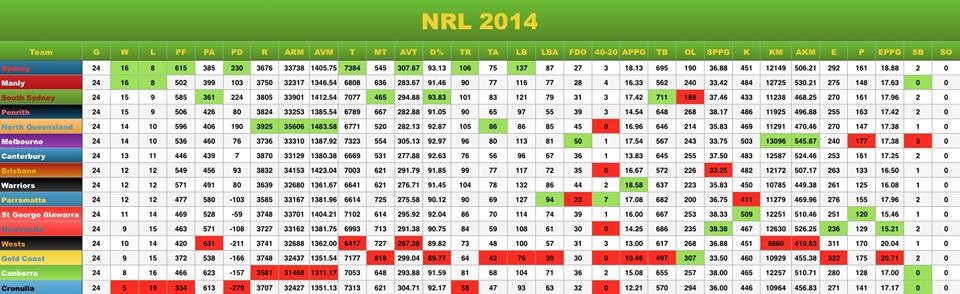
Of the 8 teams remaining Manly produce the fewest metres per game (1346), Penrith have the poorest defensive success rate (91.05%), Canterbury produced the fewest tries (76), try assists (56) line breaks (67), leading to a top 8 low of 13.83 attacking plays per game. Brisbane produce the least second phase (combination of offloads and tackle busts) per game at 33.25 SPPG compared to Penrith who produce 38.17 SPPG. The Roosters produce the most errors and penalties per game at 18.88 EPPG, while Brisbane have produced the fewest at 16.50 EPPG.
The comparisons below have been collated only from players who have been selected to play in week one of the finals. The Roosters are down on metres with the loss of Dylan Napa and Aiden Guerra to suspension. Manly and Penrith are struggling with their long list of injuries, while Souths, North Queensland and Melbourne look in very good shape coming into the weekend.
With home ground advantage and 6 wins from their past 8 games, the Roosters look the goods to beat Penrith. They lead in almost every aspect of the game.

Going purely by statistics and recent form manly look in real trouble against Souths, who have been in red hot form, despite last weeks loss to the Roosters. Adam Reynolds return should provide them with direction. However you can never write Manly off.

Home ground advantage and JT playing his best footy since 2007, this game is the Cowboys to lose.

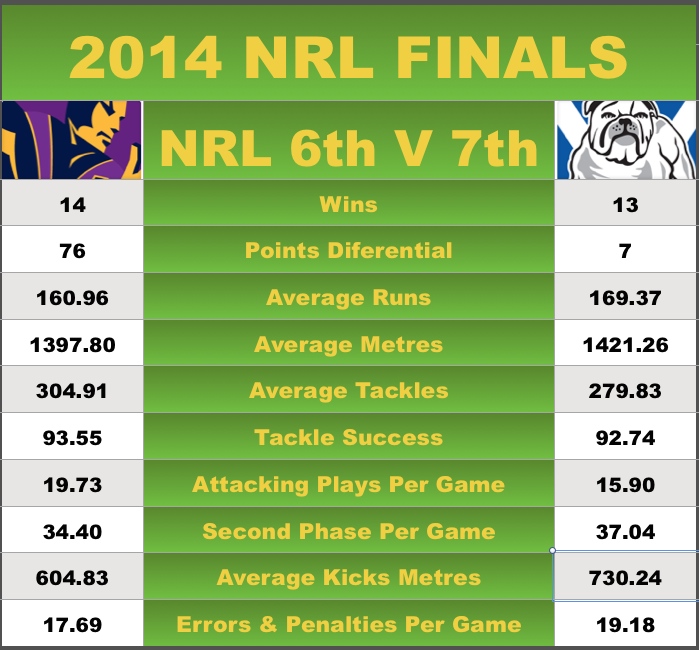
If Cameron Smith recovers from a ankle injury and takes the field it may just seal Canterbury’s fate. Melbourne have won 6 of their last 8 while the dogs have only managed 2 from their last 8.
The 8 remaining teams Halfbacks shape as the game breakers in the 2014 finals series.
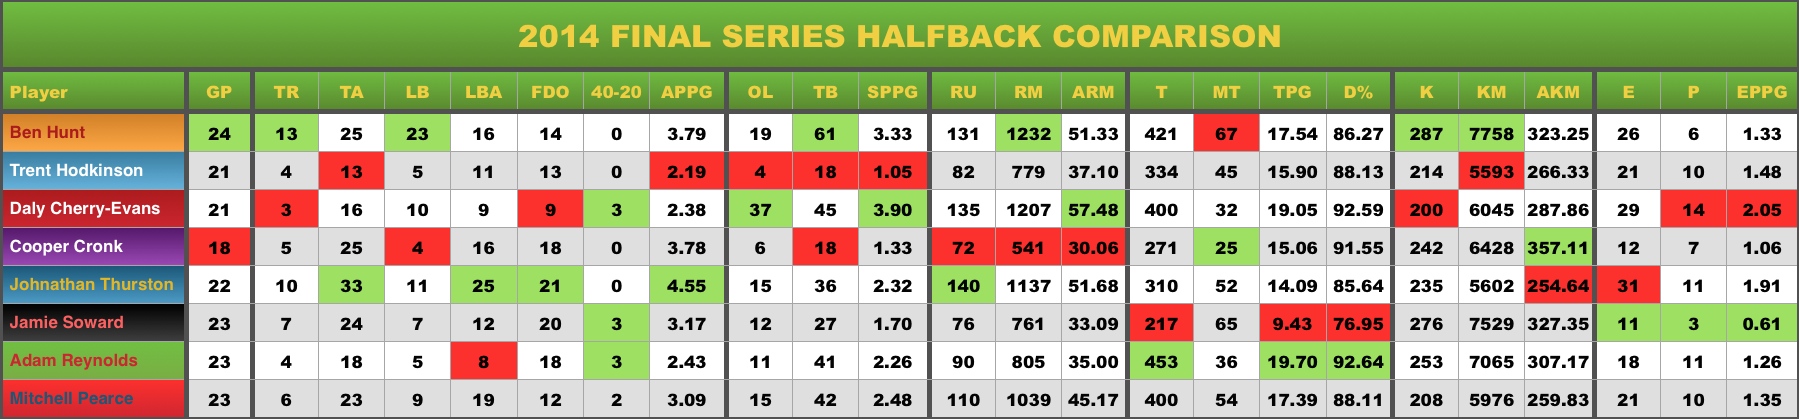
Ben Hunt has the most tries (13), line breaks (23), tackle busts (61), run metres (1232), kicks (287), kick metres (7758) and has produced the most missed tackles (61). JT leads the way in try assists (33), line break assists (25), forced drop outs (21), attacking plays per game (4.55), runs (140), he produces the fewest kick metres (254 per game) and has produced the most errors (31). DCE has produced the most offloads (37), run metres per game (57.48) and averages the most second phase per game (3.90), he has forced the fewest dropouts (9), kicks (200), he has conceded the most penalties (14) and produces more errors and penalties then any other halfback on the list (2.05 a game) Adam Reynolds is the best defensive halfback having made 453 tackles from 489 attempts at 92.64% successful, Jamie Soward is the worst, having made 217 from 282 attempts at 76.95% successful, however Soward is the most disciplined having only made 11 errors and conceded 3 penalties at 0.61 EPPG. Trent Hodkinson is the least potent attacking half on this list only averaging 2.19 APPG and 1.05 SPPG. Mitchell Pearce is the most consistent performer, he is not at the top or bottom of any category.
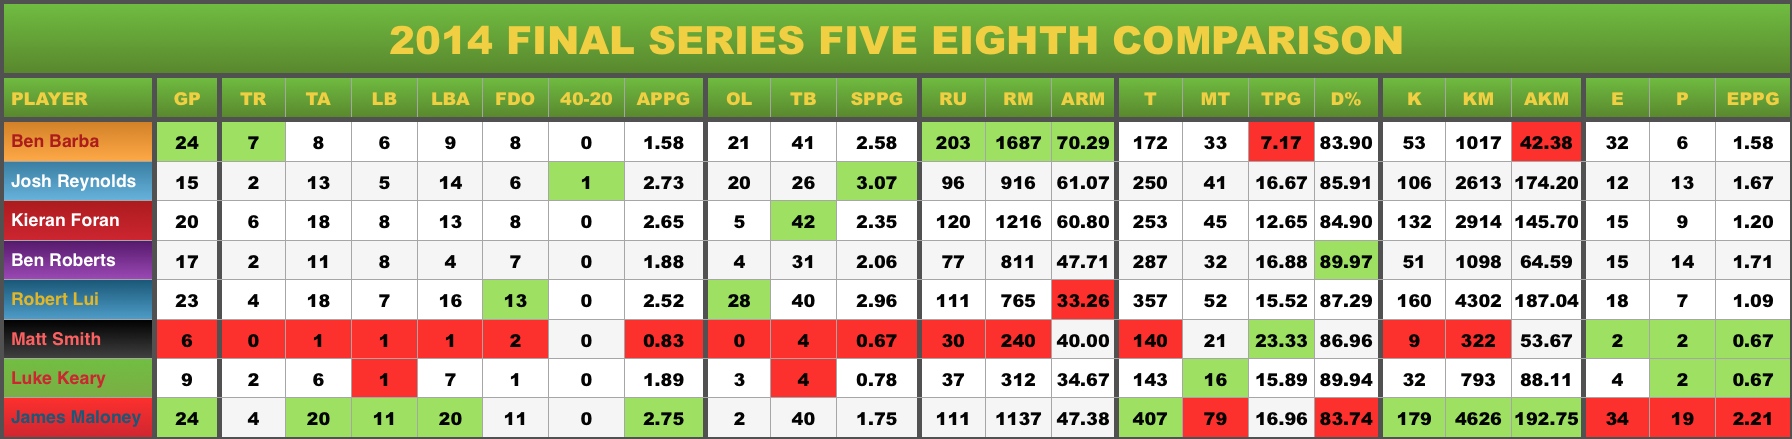
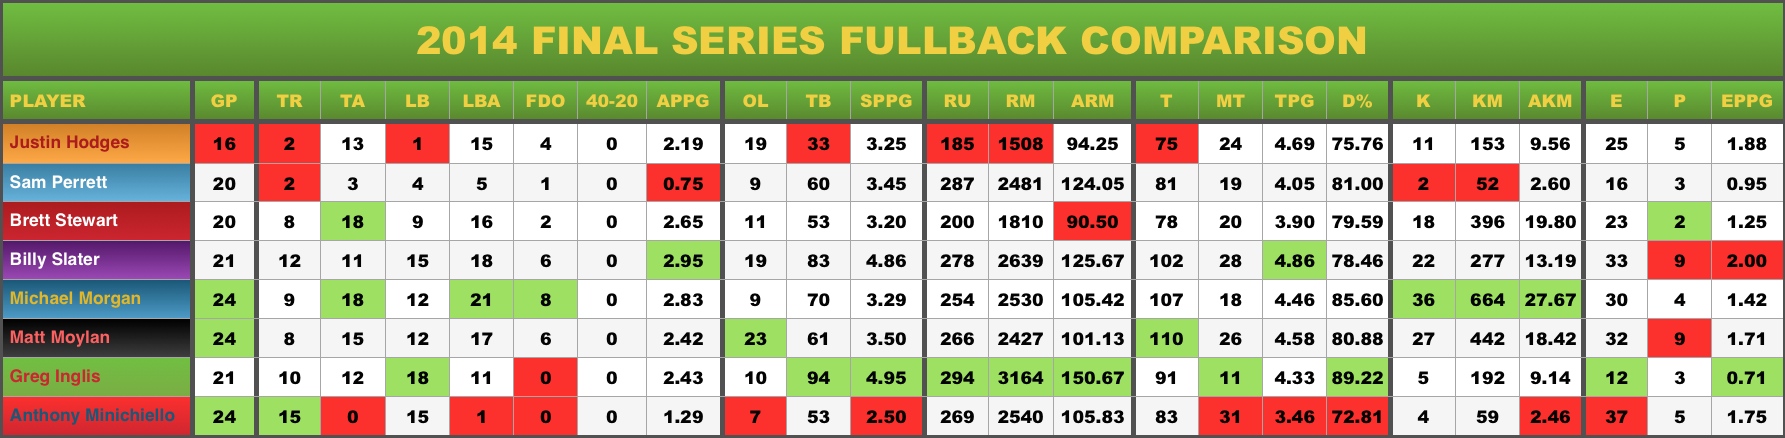
Below I have provided comparisons between all 8 team’s; Five Eighths, Hookers and Fullbacks. I didn’t go into detail about who performed best in each area, but they are their for you to compare them yourself. James Maloney, Kieran Foran, Robert Lui and Josh Reynolds could be possible game breakers this weekend.
Anthony Minichiello leads the way in tries with 15, but he falls down in multiple categories. 5 of the 8 fullbacks have won a grand final.
Cameron Smith is undeniably the best hooker, but he has some stiff competition in James Segeyaro and Jake Friend this season.

Below are comparisons between each teams bench and their starting forwards, excluding the Hooker.
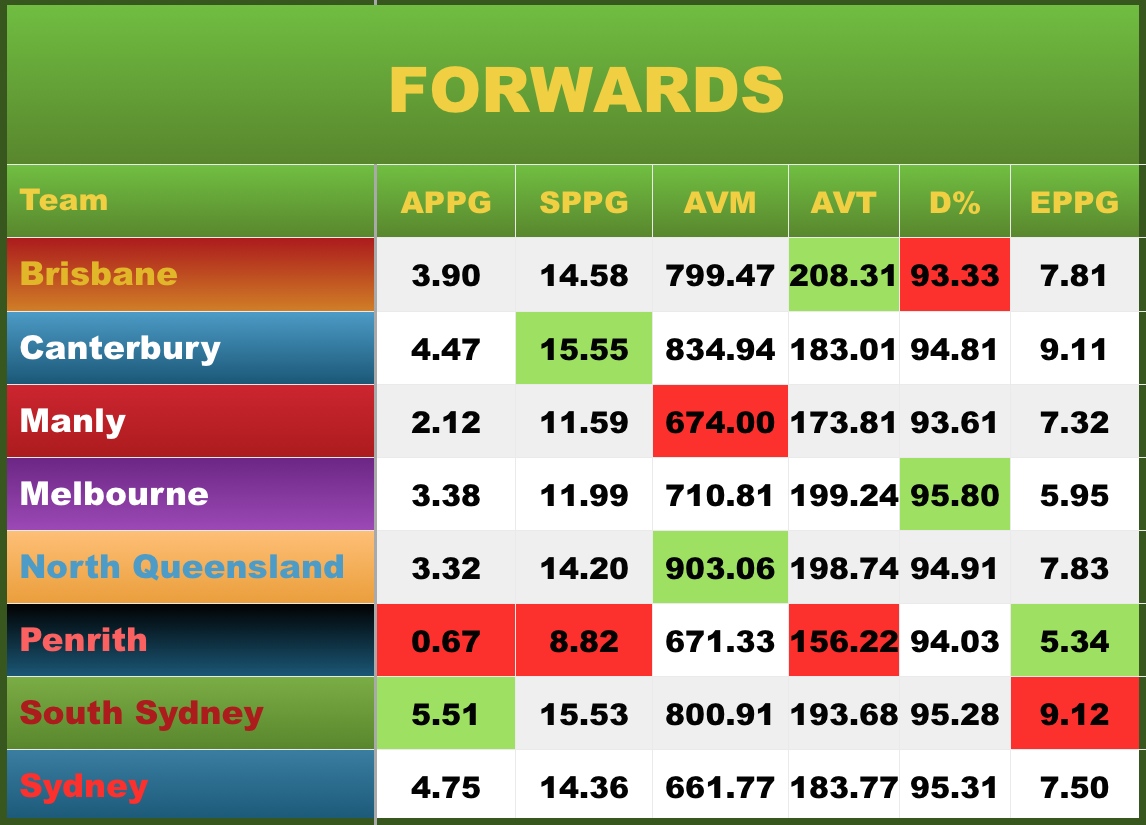
South Sydney’s pack produce the most attacking plays per game (5.51), while Penrith’s can only manage (0.67). Penrith’s pack also produce the fewest second phase per game (8.82) and the fewest tackles (156.22), however they concede the fewest errors and penalties per game (5.34), South Sydney concede the most (9.12). Canterbury produce the most second phase per game (15.55), NQ’s pack run the most metres (903.06), While Manly’s runs for the fewest (674.00). The Broncos average the most tackles (208.31), but have the lowest success rate (93.33%). Melbourne’s pack are the most effective in defence with a success rate of 95.80%.
Below is a comparison between each teams Centre and Wings.
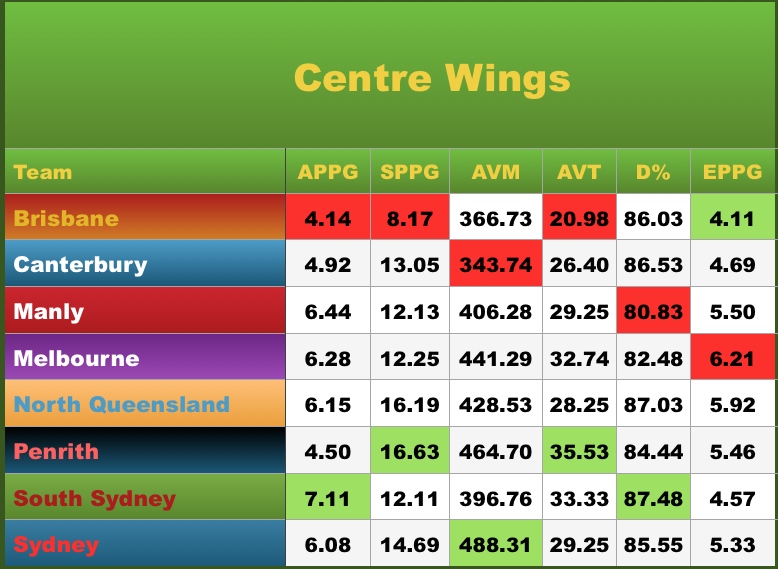
Again South Sydney produce the most attacking plays per game (7.11), Brisbane produce the fewest (4.14), as well as the fewest; second phase (8.17) tackles per game (20.98), However they produce the fewest errors and penalties per game (4.11). This comparison isn;t overly fair for Brisbane who have named Corey Oates at Centre. Penrith lead the way in second phase (16.63) and tackles per game (35.53). Sydney produce the most metres per game (488.31) and Canterbury the fewest (343.74). Souths have the most effective defence (87.48%) and Man;y have the least effective (80.83%).
Going purely on statistics and recent form I would have to back; Sydney to beat Penrith, Souths to beat Manly, North Queensland to beat Brisbane, and Melbourne to beat Canterbury.
Its finals time and anything can happen, lets hope for your teams sake it does.
For more Rugby League stats please check out the Facebook page. https://www.facebook.com/RLStats
