Johns v Thurston a statistical attempt

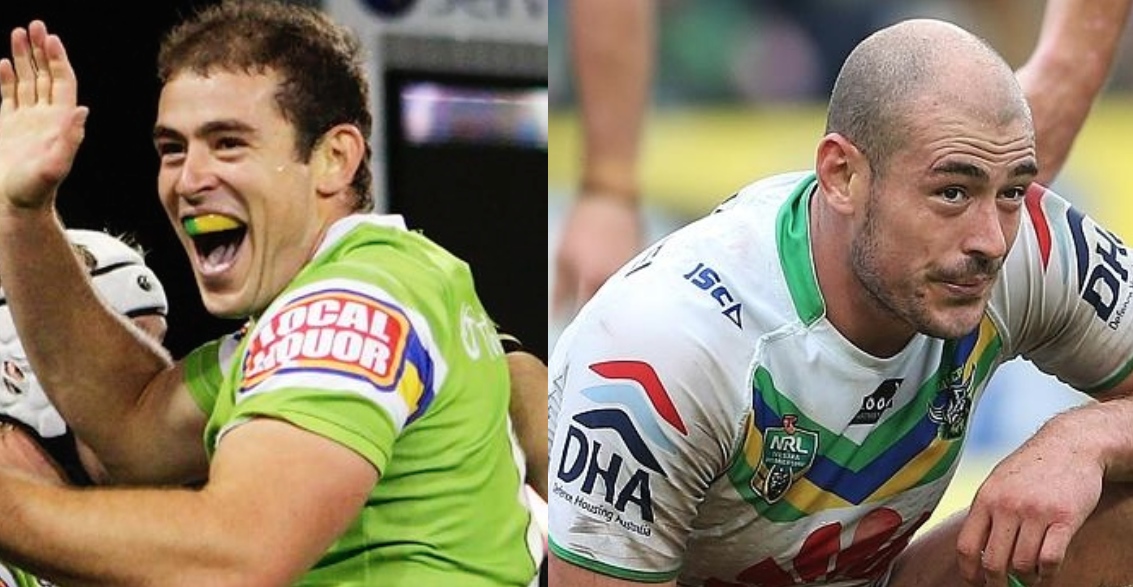
On Tuesday Fox Sports released an article attempting to compare Andrew Johns and Johnathan Thurston, by the numbers. The article only compared games, points, awards, titles, etc. In my opinion they could have done a better job. This article will attempt to go a little further.

Comparing these to great Halfbacks is no easy task, as I am not a statistician and do not have access to NRL stats databases. The stats I have managed to find on Andrew Johns are incomplete. The reason for this is the NRL did not start collecting detailed statistics (Line Breaks, Offloads, etc.) until 1998 and in the seasons that followed they increased in detail (Try Assists, Line Break Assists, etc.). Another issue with this comparison is the different stats providers, for example: all the stats I have for Andrew Johns were recorded by the NRL’s old stats provider Sports Data and the stats I have on Johnathan Thurston were recorded by Fox Sports. The reason I have not used Sports Data stats for JT is they are only available up till 2007. This is an issue because different stats providers have been shown to have differences in their records, for example: for the 2007 season Sports Data recorded 31 try assists and 19 offloads for Johnathan Thurston, while Fox Sports recorded 30 and 16 respectively. The issues mentioned above illuminates that this is a flawed attempt to compare the incomparable.

Screen Shot 2015-04-17 at 1.25.18 pm[Game statistics sourced from www.rugbyleagueproject.org]

They have each played 249 first grade games; Joey won 61.8% of games, including 2 premierships for Newcastle, while JT has won 53.8% of games across 2 clubs including 1 premiership. JT has taken part in 8 winning series for Queensland; winning 63.3% of games compared to Joey’s 5 series wins for NSW at 56.5%. As a side note: 16 of Joey’s 23 Origin appearances were at Halfback, while the other 7 were played at Hooker or off the bench. Joey won 87% of games for Australia, with 2 World Cup victories; while JT has won 93.5% of games for Australia with 1 World Cup victory.

Screen Shot 2015-04-17 at 1.25.25 pm
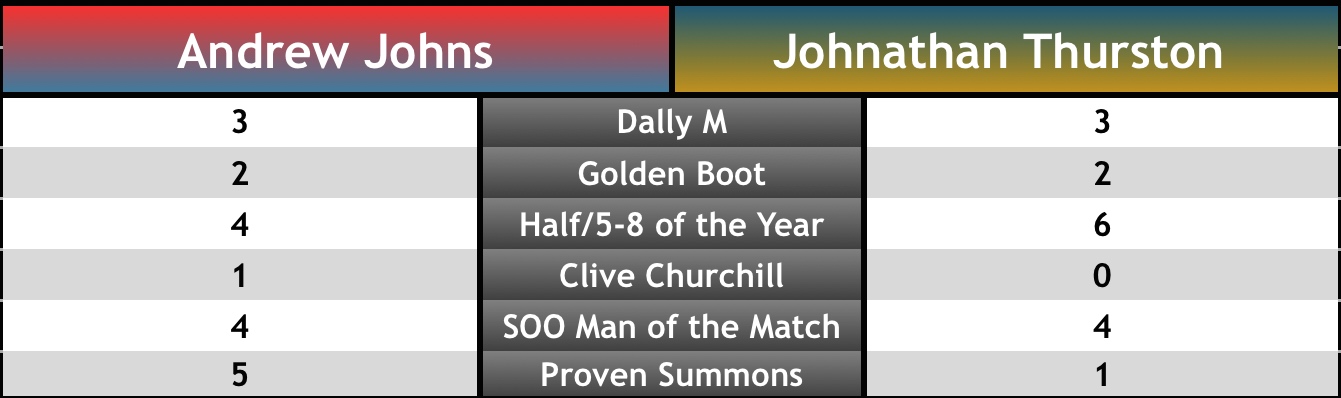
[Award statistics sourced from www.rugbyleagueproject.org]

They are equal on top with 3 Dally M Medals a piece, in addition they have taken out 2 Golden Boots. JT has the edge on Dally M positional awards with 6 (3 at Halfback and 3 at 5-8) compared to Joeys 4 at Halfback. Joey claimed a Clive Churchill Medal in 2001, the only major award JT is without.

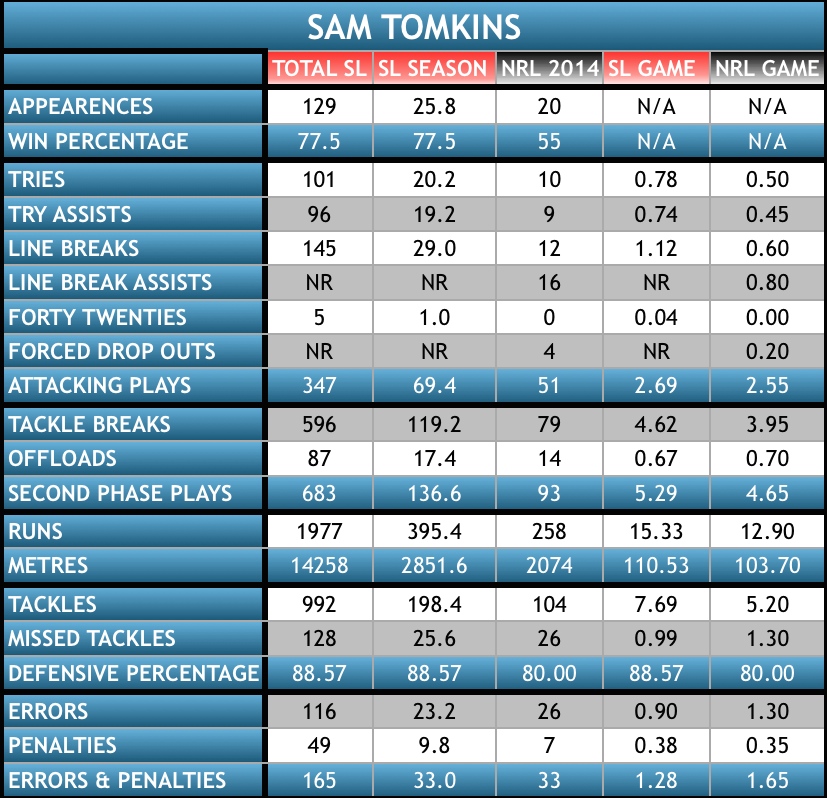
To this point we have covered all the basic stats that everyone already knows; we will now delve into the nitty gritty, starting with their attacking game.

JT V Joey
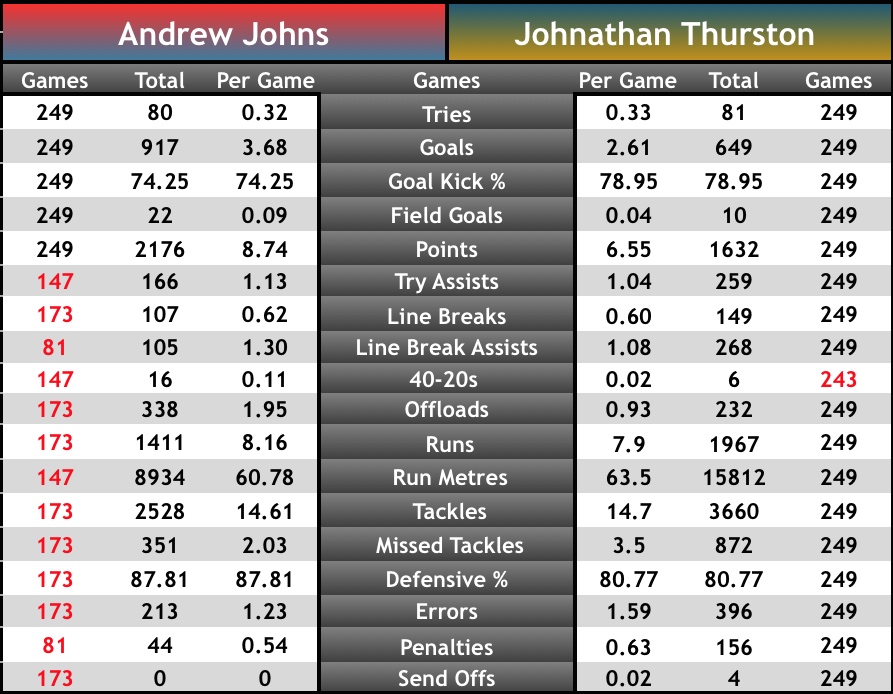
[Andrew Johns Stats sourced from Sports Data’s NRLstats.com; Johnathan Thurston Stats Sourced from Fox Sports.]

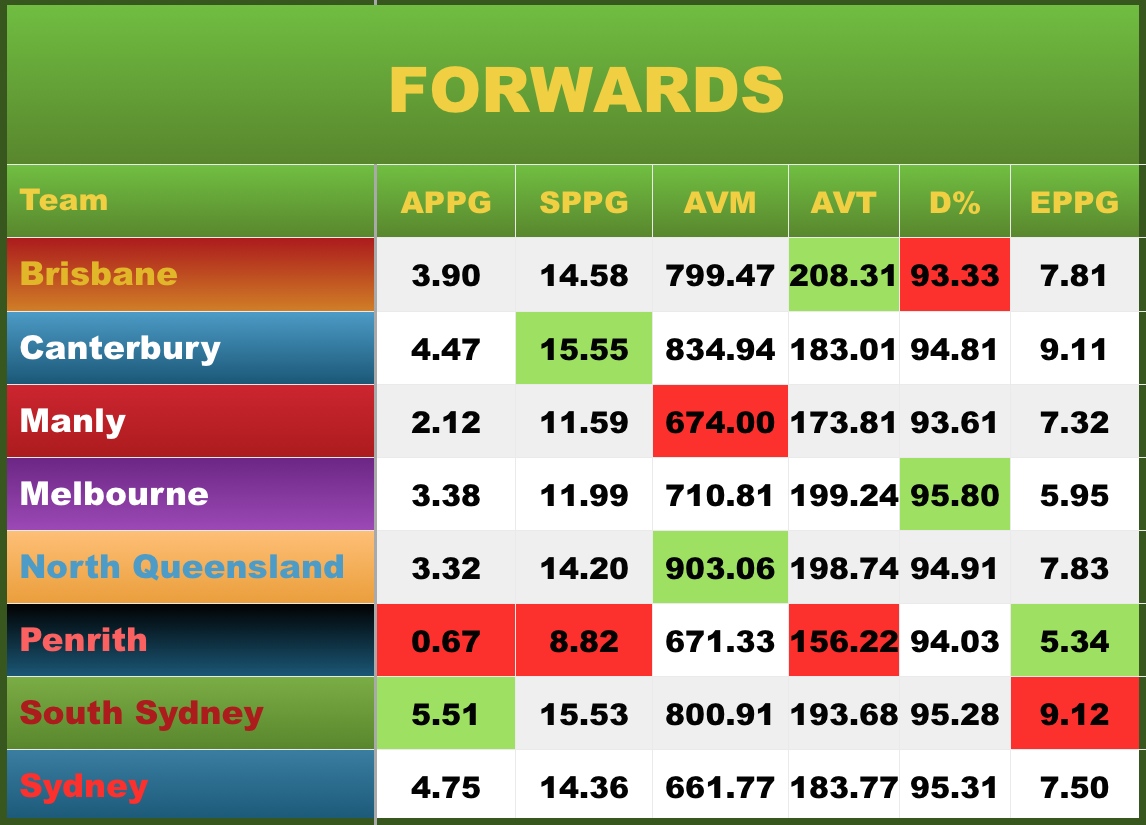
As discussed above the stats I found on Andrew Johns were incomplete, which makes this comparison unfair for both players. We of course have a complete record of Joey’s tries; scoring 80 from his 249 games compared to JT who has crossed the line 81 times from 249 games, a per game strike rate of 0.32 and 0.33 respectively. I only have try assist stats for 147 of Joey’s appearances, where he managed 166 at a strike rate of 1.13 per game. JT has assisted in 259 tries at a strike rate of 1.04 per game. Joey broke the line 107 times in the 173 games that were recorded, a strike rate of 0.62 per game; compared to 149 line breaks made by JT at 0.60 per game. Line Break Assists is the smallest sample I have on Johns as they were only recorded for 81 of his 249 appearances. In that period Joey assisted in 105 line breaks at a rate of 1.30 per game. JT has assisted 268 line breaks at a rate of 1.08 per game. Joey dominated when it came to forty twenties; kicking 16 from the 147 games recorded at 0.11 per game; compared to JT who has only managed 6 from 243 games (couldn’t find stats on a few finals games) at 0.02 per game.

Joey produced 338 offloads in the 173 games that they were recorded at 1.95 per game; compared to JT who has to date produced 232 offloads at 0.93 per game. Joey averaged 60.78 metres per game in the 147 that were recorded; compared to JT who has averaged 63.50 across his career. It’s fair to say that if we had complete stats on Joey’s career his per game averages would slide back towards JT’s numbers; however, how much is unclear as we are missing stats on years where he won a Premiership, a Dally M and a Halfback of the year award.

 Johns DefenceThurston Defence[Andrew Johns stats sourced from Sports Data from 173 of 249 games, Johnathan Thurston’s stats sourced from Fox Sports across 249 games = % (total tackles/total attempts displayed as percentage)]

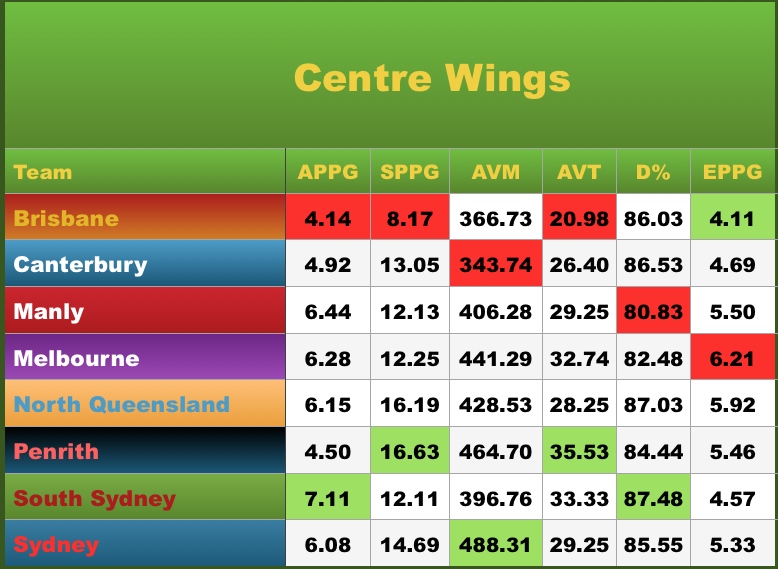
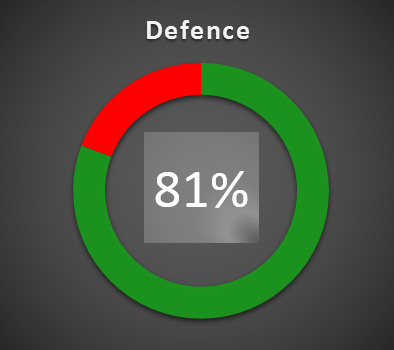
I found Defensive stats for 173 of Joey’s games where he averaged 14.61 tackles per game, missing 2.03 per game. JT‘s has averaged 14.70 tackles per game across his career averaging 3.50 misses. Fox Sports has JT’s effectiveness in defence at 75%; this must include ineffective tackles, which I could not find figures for. To be fair to JT I used the same simple formula that was used for Joey (total tackles made divided by total tackles attempted times 100). Using this simple method Joey made 88% of all tackles attempted compared to JT who has been 81% successful.

When it comes to errors and penalties the stats I found indicate that JT is slightly less disciplined. In the 173 games that errors were recorded, Joey made 213 at 1.23 per game, compared to JT who has made 396 errors at 1.59 per game. Penalties were only recorded for 81 of Joey’s games where he conceded 44 at 0.54 per game, compare to JT who has conceded 156 at 0.63 per game. In addition JT has also been sin binned on 4 occasions. I am not sure if Joey has ever been sent to the bin.

Screen Shot 2015-04-17 at 1.25.43 pm[Andrew Johns stats sourced from Sports Data; Johnathan Thurston’s stats sourced from Fox Sports. Highlighted red text means the data is incomplete. * Numbers have been derived from per game averages times the total games, therefore the figure will not be totally accurate.]

Numbers won’t settle the debate as people either love or hate these two players. From my perspective it has been fantastic watching these two magicians dominate over the years.

2014 NRL Finals

After 26 rounds the final series is upon us. 8 teams remain in the hunt to be crowned 2014 NRL champions. Since the conclusion of the bye period in round 18, the Sydney Roosters and North Queensland Cowboys have racked up 7 wins from 8 games, a spectacular run of form to take into the finals series. Souths and Melbourne have won 6 from 8, Manly have won 5 from 8, Penrith and Brisbane have won 4 from 8 and out of form Canterbury have only managed 2 wins from 8.

IMG_1838

The Sydney Roosters swooped in under the radar and stole the minor premiership from Manly in the last round. Looking at this seasons collated statistics it is clear how they managed this. The Roosters finished the regular season with the most points (615), the best differential (230), most tackles (7384 at 307 per game), tries (106) and line breaks (137). They had the second highest success rate in defence (93.13%), just slightly behind Souths (93.83%) and produced the second most attacking plays per game (18.13 APPG), second only to the Warriors (18.58 APPG).  South Sydney conceded the fewest points (361), missed the fewest tackles (465) and as stated above had the highest defensive success rate of any team in the regular season. They also produced 711 tackle breaks, the most of any team. The Cowboys finished the regular season with the most try assists (86), metres (35606 at 1483 per game),  while Melbourne forced more drop outs then any other team (50)

IMG_1837

Of the 8 teams remaining Manly produce the fewest metres per game (1346), Penrith have the poorest defensive success rate (91.05%),  Canterbury produced the fewest tries (76), try assists (56) line breaks (67), leading to a top 8 low of 13.83 attacking plays per game. Brisbane produce the least second phase (combination of offloads and tackle busts) per game at 33.25 SPPG compared to Penrith who produce 38.17 SPPG.  The Roosters produce the most errors and penalties per game at 18.88 EPPG, while Brisbane have produced the fewest at 16.50 EPPG.

The comparisons below have been collated only from players who have been selected to play in week one of the finals. The Roosters are down on metres with the loss of Dylan Napa and Aiden Guerra to suspension. Manly and Penrith are struggling with their long list of injuries, while Souths, North Queensland and Melbourne look in very good shape coming into the weekend.

Screen Shot 2014-09-12 at 1.48.57 am

With home ground advantage and 6 wins from their past 8 games, the Roosters look the goods to beat Penrith. They lead in almost every aspect of the game.

Screen Shot 2014-09-12 at 1.48.27 am

Going purely by statistics and recent form manly look in real trouble against Souths, who have been in red hot form, despite last weeks loss to the Roosters. Adam Reynolds return should provide them with direction. However you can never write Manly off.

Screen Shot 2014-09-12 at 1.48.28 am

Home ground advantage and JT playing his best footy since 2007, this game is the Cowboys to lose.

Screen Shot 2014-09-12 at 1.48.32 am

If Cameron Smith recovers from a ankle injury and takes the field it may just seal Canterbury’s fate. Melbourne have won 6 of their last 8 while the dogs have only managed 2 from their last 8.

Screen Shot 2014-09-12 at 1.48.33 am

The 8 remaining teams Halfbacks shape as the game breakers in the 2014 finals series.

Screen Shot 2014-09-11 at 10.32.55 am

Ben Hunt has the  most tries (13), line breaks (23), tackle busts (61), run metres (1232), kicks (287), kick metres (7758) and has produced the most missed tackles (61). JT leads the way in try assists (33), line break assists (25), forced drop outs (21), attacking plays per game (4.55), runs (140), he produces the fewest kick metres (254 per game) and has produced the most errors (31). DCE has produced the most offloads (37), run metres per game (57.48) and averages the most second phase per game (3.90), he has forced the fewest dropouts (9), kicks (200), he has conceded the most penalties (14) and produces more errors and penalties then any other halfback on the list (2.05 a game) Adam Reynolds is the best defensive halfback having made 453 tackles from 489 attempts at 92.64% successful, Jamie Soward is the worst, having made 217 from 282 attempts at 76.95% successful, however Soward is the most disciplined having only made 11 errors and conceded 3 penalties at 0.61 EPPG. Trent Hodkinson is the least potent attacking half on this list only averaging 2.19 APPG and 1.05 SPPG. Mitchell Pearce is the most consistent performer, he is not at the top or bottom of any category.

Below I have provided comparisons between all 8 team’s; Five Eighths, Hookers and Fullbacks. I didn’t go into detail about who performed best in each area, but they are their for you to compare them yourself. James Maloney, Kieran Foran, Robert Lui and Josh Reynolds could be possible game breakers this weekend.

Screen Shot 2014-09-11 at 11.38.27 am

Anthony Minichiello leads the way in tries with 15, but he falls down in multiple categories. 5 of the 8 fullbacks have won a grand final.

Screen Shot 2014-09-11 at 11.38.30 am

Cameron Smith is undeniably the best hooker, but he has some stiff competition in James Segeyaro and Jake Friend this season.

Screen Shot 2014-09-11 at 11.38.23 am

Below are comparisons between each teams bench and their starting forwards, excluding the Hooker.

Screen Shot 2014-09-11 at 12.29.16 pm

South Sydney’s pack produce the most attacking plays per game (5.51), while Penrith’s can only manage (0.67). Penrith’s pack also produce the fewest second phase per game (8.82) and the fewest tackles (156.22), however they concede the fewest errors and penalties per game (5.34), South Sydney concede the most (9.12). Canterbury produce the most second phase per game (15.55), NQ’s pack run the most metres (903.06), While Manly’s runs for the fewest (674.00). The Broncos average the most tackles (208.31), but have the lowest success rate (93.33%). Melbourne’s pack are the most effective in defence with a success rate of 95.80%.

Below is a comparison between each teams Centre and Wings.

Screen Shot 2014-09-12 at 2.55.12 am

Again South Sydney produce the most attacking plays per game (7.11), Brisbane produce the fewest (4.14), as well as the fewest; second phase (8.17) tackles per game (20.98), However they produce the fewest errors and penalties per game (4.11). This comparison isn;t overly fair for Brisbane who have named Corey Oates at Centre. Penrith lead the way in second phase (16.63) and tackles per game (35.53). Sydney produce the most metres per game (488.31) and Canterbury the fewest (343.74). Souths have the most effective defence (87.48%) and Man;y have the least effective (80.83%).

Going purely on statistics and recent form I would have to back; Sydney to beat Penrith, Souths to beat Manly, North Queensland to beat Brisbane, and Melbourne to beat Canterbury.

Its finals time and anything can happen, lets hope for your teams sake it does.

For more Rugby League stats please check out the Facebook page.  https://www.facebook.com/RLStats

2014 DALLY M

Screen Shot 2014-08-30 at 9.21.09 am


With only one and a half rounds to go the race for the Dally M has hotted up. At this point there appears to be a three main contenders, consisting of Johnathan Thurston, Jarryd Hayne & Sam Burgess. Thurston (2005 & 2007) & Hayne (2009) have previously been crowned the NRL’s best player, while Same Burgess has history against him. The last Forward other then a Hooker to win the Dally M was Gavin Miller in 1988 and 1989. Despite leading the Dally M points after 16 rounds, it appears going by predictions that Ben Hunt has dropped out of the top three, however after a stunning performance last night, starring in a win over the Dragons, he could have roared back into contention. 

Sam Burgess put on a Match winning performance Thursday night and has done him self no harm in breaking the drought of running forwards winning the Dally M. 

Below I have added a comparison between Johnathan Thurston’s and Jarryd Hayne’s Dally M winning years compared to 2014 and it indicates that both man are in similar form to when they were crowned the games best. 

 Screen Shot 2014-08-30 at 10.47.18 am                                    If I was a betting man I would be putting my money on either JT or Jarryd Hayne to take out the title of the games best in 2014. They each have two games to go and each performance is crucial. 

For more Rugby League Stats check out our Facebook page;

https://www.facebook.com/RLStats


Terry Campese Then and Now

Terry Campese was told this week that he was no longer guaranteed a spot in first grade. He now seems destined to play out his contract for Mounties in NSW Cup or perhaps, or perhaps he may receive an offer from Super League, Canberra however may not be interested in topping up his wage. Since the initial injury sustained in the 2010 finals series, the one time Australian & NSW pivot has failed to recapture the stellar form he displayed from 2008 to 2010. He has only managed 43 games in the past 4 seasons, as opposed to the 87 in the 4 seasons prior to his string of injuries. Of the 43 games he has lined up for since the 2010 injury, he has only seen 17 victories at 39.5%, as opposed to the 47% success rate between 2008-2010, where Canberra made the finals on 2 occasions (2008 & 2010). 

Screen Shot 2014-08-17 at 8.55.27 pm

Terry’s attacking stats since 2010 have seen a reduction in all areas, most noticably his running game.  Prior to the injury Terry was running on average 6 times a game for 50 metres, from 2011 onwards he has only been running the ball slightly over 2 times a game for under 20 metres. Terry’s diminished running game has had a flow on effect to all other areas of his game, his ability to produce second phase plays has dropped dramatically. Between 2008-10 Campese would on average offload 1.4 times a game and break 2.3 tackles. Since 2010 he has only managed 0.4 offloads per game and 0.7 tackle breaks. 

Screen Shot 2014-08-17 at 9.08.16 pm

Terry’s defence has also suffered post injury, possibly due to a reduced ability to move laterally fast enough in response to changing attack. Between 2008-10, he averaged 18.5 tackles per game, only missing 1.8 on average, a success rate of 91%. This percentage was better then many back rowers playing the game and was on par with John Sutton. Since the injury Terry has averaged 16.3 tackles per game missing 2.1 on average, a success rate of 88%. This percentage is still high for a half, but is statistically significant.

Screen Shot 2014-08-18 at 9.33.21 am

Above and below are comparisons of regular season form between Cooper Cronk and Terry Campese from 2008 to 2010. These comparisons help to illustrate the kind of player Terry Campese was and only begs the question how good could he have been if not for a horrible string of injuries. Keep in mind these are only the raw numbers of a Five Eighth and Halfback, but both where the dominant halves for their club during this period. During this period Cooper only out pointed Terry in Try Assists, Errors and Penalties. Terry averaged more Try’s, Line Breaks, Line Break Assists, Forty Twenties, Forced Drop Outs, Offloads, Tackle Busts, he missed fewer tackles and had a higher defensive success rate. 

Screen Shot 2014-08-18 at 9.35.44 am

Injury has robbed Terry Campese the opportunity to ever fulfil his full potential. Frustrated Canberra fans have had enough of losing and many blame Terry for not reaching his former heights and for taking up so much of the Salary cap, however it is not his fault Canberra decided to sign him on such a lucrative deal after he sustained the devastating injury, that mistake is on the Raiders administration. Lets hope he can see out the rest of his career injury free, enjoying what time on the paddock he has left. 

For more Rugby League Stats please check out the Facebook page:

https://www.facebook.com/RLStats

Sam Tomkins Boom or Bust in the NRL

Screen Shot 2014-08-11 at 11.48.27 am

Sam Tomkins made the brave move to leave his beloved club Wigan and take on the NRL in 2014. He left the English Super League having achieved it all, he won two Premierships 2010 & 2013, two Challenge Cups 2011 & 2013 and was named player of the year (Man of Steel) in 2012. Sam has represented England on 25 occasions scoring 21 tries. He played 129 Super League matches, winning 100, giving him the ridiculous winning percentage of 77.5%. To put it into perspective Cameron Smith’s winning percentage in slightly below 70% and he has played for the most dominant team of the last decade. Of course the Super League is not a competitive as the NRL. For example the bottom placed London Broncos have lost all 23 games in 2014, while bottom placed Canberra and Cronulla have each won 5.

The New Zealand Warriors had to pay a world record transfer fee of 700,000 pounds to acquire Tomkins from Wigan. His arrival signalled the beginning of the end for talented Fullback Kevin Locke’s association with the Warriors, has Sam been worth or the fuss and money?

Screen Shot 2014-08-11 at 11.51.04 am

By the numbers Sam Tomkins as played in all 20 games for the Warriors in 2014 and won 11, a winning percentage of 55%. He has scored 10 tries, set up 9, broke the line 12 times, assisted in 16 line breaks and forced 4 drop outs. His strike rate is down in all departments when compared to his numbers in Super League but that is to be expected. Super League do not record line break assists or forced drop outs, so I cannot get an accurate figure on attacking plays per game, on the stats available its 2.7, so you could safely estimate somewhere around 3.5 to 4 APPG.

In the NRL Sam has produced 2.6 Attacking Plays Per Game (APPG), on par with Brett Stewart, Greg Inglis and only slightly below Billy Slater with 2.8 APPG. Surprise packet Michael Morgan is in killer form averaging 3.3 APPG, but man of the year Jarryd Hayne is sitting pretty on top with 4.1 APPG. These numbers indicate that in attack Tomkins has not been outclassed and can match it with some of the biggest names in the NRL. As a side note gun young Fullback Anthony Milford who is not included in the picture above has averaged 2.75 APPG in 2014.

Sam has broken 79 tackles and offloaded 14 times in 2014, giving him an average of 4.7 Second Phase Per Game (SPPG), a higher rate then Brett Stewart (2.9 SPPG), Michael Morgan (3.6 SPPG) and Billy Slater (4.3 SPPG). Of the Fullbacks shown above only Greg Inglis (4.9 SPPG) and Jarryd Hayne (7.1 SPPG) are more proactive when it comes to second phase. Anthony Milford has averaged 6.25 SPPG.

Sam has run 258 times for 2074 metres at 103.7 per game. This is only slightly less then his average run metres in Super League (110.5) and is a solid contribution. He averages more metres then Brett Stewart (89.4) and Michael Morgan (100.9). Billy Slater (117.4), Greg Inglis (143.6) and Jarryd Hayne (174.2) have run for significantly more metres. Anthony Milford has averaged 104.65 metres per game.

In defence Tomkins has been impressive given his diminutive stature. He has made 104 tackles from 130 attempts at 80% successful. 80% is a very good percentage for a NRL fullback. Hayne, Slater, Inglis and Stewarts career average in the position are all slightly below or above 80%. In Super League Sam defended at 88% successful, I have not seen any NRL Fullback do this for an extended period of time. His defence in 2014 has been better then Jarryd Hayne’s (75.31), Billy Slater’s (76.99) and Brett Stewarts (79.52). Michael Morgan (86.92) and Greg Inglis (88.89) are at a new level when it comes to defending at fullback in 2014. Anthony Milford’s has been defending at 65.77% in 2014.

When it comes to discipline Sam has made 26 errors and given away 7 penalties for an average of 1.7 Errors/Penalties Per Game (EPPG), 0.4 more then his average in the Super League. This is a better rate then Billy Slater and Jarryd Hayne, who both average 1.9 EPPG, but significantly worse then Michael Morgan (1.5), Brett Stewart (1.0) and Greg Inglis (0.6). Anthony Milford has averaged 1.3 EPPG.

In conclusion Sam Tomkins first year in the world’s hardest Rugby League competition has been a success. He has matched it with some of the biggest names and shown he is up for the challenge. It’s good to see a quality English player come to Australia in their prime and have a crack. It’s a shame we shall never see the likes of James Roby or Kevin Sinfield run around the NRL.

For more Rugby League Stats please check out our Facebook Site:

https://www.facebook.com/RLStats


2014 Prop Comparison

Screen Shot 2014-08-05 at 7.54.52 pm


After 21 rounds of the NRL competition the jury is still out on who has been the best Prop in 2014. There have been a number of standout performers, including but not limited to: Matt Scott, Corey Parker, Jesse Bromwich, James Graham, Aaron Woods, Josh McGuire and George Burgess.

The ever improving Paul Vaughan has more tries and line breaks then all other props with 6 and 5 respectively. Martin Taupau also has 5 line breaks to his name. Jesse Bromwich has the most try and line breaks assists with 3 and 5 respectively. Andrew Fifita is equal in try assists with 3. Corey Parker has the second most line break assists with 4. Andrew Fifita has been stifled by injury for most of the season, but he averages more attacking plays per game then any other Prop at 0.67 APPG.

Andrew Fifita is also the king of second phase averaging 7.5 SPPG (Parker second with 4.06 SPPG), including 53 tackle breaks and 37 offloads. He is second in both tackle bust and offloads, behind Martin Taupau with 56 tackle breaks and Corey Parker with 50 offloads. Meat and Potatoes Prop Josh Starling is the least active Prop when it comes to second phase only averaging 0.32 SPPG, including 2 tackle breaks and 4 offloads.

Jesse Bromwich is the biggest metre eater so far in 2014, running 286 timed for 2705 metres at 143 metres per game. James Graham has ran the most hit ups with 297, George Burgess has ran the second most metres with 2426 and Matt Scott has the second best average metres per game, running 139 per game. Sam McKendry runs the least metres per game of all Props on this list, running for just under 80 per game.

Josh McGuire has made more tackles then all other props in 2014 with 632 at 35 a game. Aiden Tolman is the most effective Prop in defence, he has 345 tackles from 350 attempts at 98%. Nate Myles has missed the most tackles with 53, making him the least effective prop on this list. Myles has made 519 tackles from 572 attempts at just over 90%.

The trend of potency in attack leading to a higher error rate continues. Andrew Fifita the best Prop in attack is also the least disciplined making on average 2.08 Errors/Penalties Per Game (EPPG), he has the most errors with 15 and has 11 penalties. JWH is them most penalised Prop in 2014 with 24 to his name. Reformed bad boy Willie Mason is the most disciplined at 0.35 EPPG, including 2 errors and 4 penalties.

Best by the Numbers: Jesse Bromwich (rates high in all areas and has no downsides)

Worst by the Numbers: Nate Myles (surprising, but has high error rate, worst defence, doesn’t average over a hundred metres a game, averages under one second phase play and has not registered a single attacking play in 2014)

For more Rugby League Statistics check out our Facebook page:

https://www.facebook.com/RLStats

2014 Second Row Comparison

Screen Shot 2014-08-05 at 7.54.48 pm

Sonny Bill Williams as you may expect dominated most areas when compared to all other Second Row Forwards. In attack he has the most try assists with 4 and the most line break assists with 11. Simon Mannering has the most tries with 9 and Boyd Cordner leads the line breaks with 9. Ex Five Eighth Wade Graham has registered 4 forced drop outs more then any other Second Rower. SBW averages 1.53 Attacking Plays Per Game (APPG) followed by Dave Taylor (1.22), Boyd Cordner (1.21), Wade Graham (1.16), Simon Mannering (1.16), Matt Gillett (1.13) and Tony William (1.06). No other Second Rower averaged over 1.00 APPG. Elijah Taylor is the worst attacking Second Rower with a poor average of 0.18 APPG.

SBW leads the way in Second Phase Per Game with 4.87 with 37 tackle busts and 36 offloads, ahead of Tony Williams (4.28). No other Second Rower averages over 4.00 SPPG. Jason Taumalolo leads the tackle busts with 56 but he only has registered 5 offloads for the season, this gives him an average of 3.21 SPPG. Ryan Hoffman is the least active Second Rower when it comes to second phase only averaging 0.89 SPPG.

Dave Taylor has ran more metres then any other Second Rower in 2014, with 253 runs for 2394 metres at 133 metres per game. SBW and Jason Taumalolo average the second most metres per game with 117 a piece. Chris McQueen averages the fewest metres at only 60 metres per game.

Tackling machine Elijah Taylor leads the tackle count for Second Rowers with 576 at 33 per game to his name. Leeson Ah Mau is the most effective in defence with 454 tackles from 466 attempts at 97.42% effective. SBW comes in second with 337 tackles from 350 attempts at 96.29% effective. Dave Taylor has spent significant time in the Centres this year and his defence has suffered with a effective percentage of 84.13.

With great attacking ability comes errors and second rowers are no different with SBW leading the Errors/Penalties Per Game (EPPG) stat with 2.00. SBW has 21 errors equal with Wade Graham and 9 penalties. Wade Graham also leads the penalty count with 15. Gun defender Leeson Ah Mau is the most disciplined Second Rower only averaging 0.58 EPPG.

Best by the numbers: SBW

Worst by the numbers: No stand out apparent.

For more Rugby League stats check out our Facebook page:

https://www.facebook.com/RLStats