State of Origin Game 1 Comparison

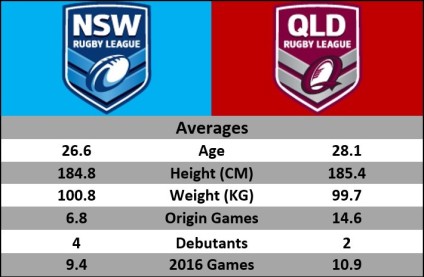
Trying to provide a meaningful matchup of two teams is no easy task; especially for someone who isn’t a statistician. I shall do my best anyway. As expected the Maroons average age is greater than that of the blues. There is little difference in height and weight; with the average Maroon towering above their Blues opponent by 0.6cm. The Blues have a slight advantage in the weigh in. The first disparity becomes apparent in the Origin experience department, with Queenslanders averaging twice as many origins games per player (14.6 to 6.8). The Maroons squad has suffered fewer disruptions on the park in 2016; the only man to have missed any game time this year is Corey Oates; who missed one game earlier in the season. The Blues by comparison have missed 27 games this year due to injury and suspension. In other words Queenslander’s have participated in 99% of possible games this year compared to the New South Welshman who have only played 85%.
SOO G1 2016 1

Attack

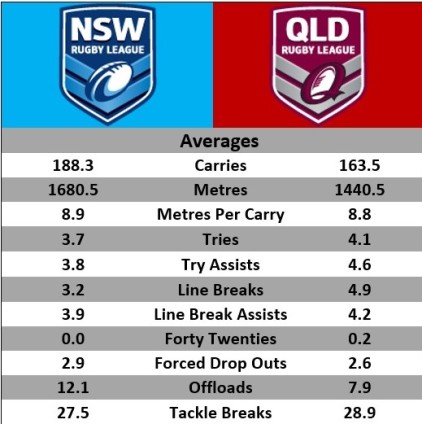
The following stats have been derived from 2016 season totals and adjusted to try and reflect what could possibly be produced in a single game performance per team; it is far from perfect, but it might reveal some interesting talking points. What I mean by adjustment is when the stats are pooled together and averaged they won’t reflect what is possible in a single team performance. For example NSW players have played 26 less games then QLD players, therefore, there will be a discrepancy between the two teams. Another area that requires adjusting is the total minutes available per game. For example: when the averaged minutes played per player for each team are summed into team totals, the Blues squad average 1190 minutes per game and the Maroons average 1203; however, there is only 1040 available playing minutes in an 80 minute game (13 X 80 = 1040). To adjust these two factors I broke both squads into 2 groups: the backs (1-7 and 9 assuming both Hookers will play 80 minutes) and the forwards (8, 10-17). I assumed that all the backs would play 80 minutes; giving them 640 of the 1040 available minutes. The forwards would have to share the remaining 400 minutes between the 9 of them. All categories were adjusted to reflect the maximum possible games that could have been played this season, as well as the maximum possible minutes available per game. A good example is average metres per game. If you summed the average metres per game of each NSW player you end up with 2013.5 total metres per game; which is not realistic because to get that figure there needs to be an additional 150 playing minutes per game. So when adjusted for maximal games and possible minutes the 2013 metre figure comes down to 1680 metres per game. That figure is still high for an average team, but this is a rep team and if NSW has anything it is metre eating forwards. All the figures below have had the same adjustment applied to them.
SOO G1 2016 2

I have done this comparison for a number of years and it has always looked pretty similar. NSW tend to have the advantage in metres per game, as well as offloads and often tackle breaks; Queensland tend to be on top in every other attacking category, especially forced drop outs. This year that single figure has gone the way of NSW (2.9 to 2.6). Forcing repeat sets has been lacking for NSW year in year out. For example the year James Maloney and Mitchell Pearce were selected to play for NSW they had accumulated the fewest repeat sets of any halves combination in the NRL up until that point of the season. They did go on to win the competition that season so… make of that what you will. The addition of Adam Reynolds, who has 8 repeats from 6 games in 2016, gives the Blues a pressure building weapon that they have sorely missed.

Defence

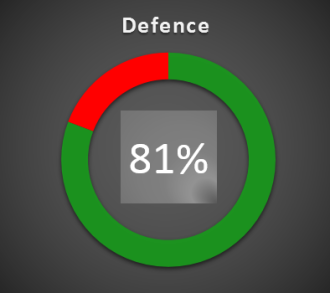
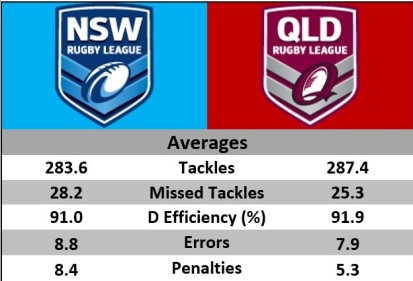
The adjustments were also applied to the defensive and discipline statistics below and they too reveal a pattern that I have seen over the last few years; the Maroons tend to average more tackles, miss fewer, and produce fewer errors/penalties. The physical destruction of the Blues in last years decider was built on the back of a negative mindset that the Blues would lose the penalty count regardless; which, as we all witnessed, lead to one dumb grubby decision after another, which ultimately lead to the their systematic slaughter at the hands of an experienced professional Maroons team. So with that being said penalties and errors could hurt NSW again.
SOO G1 2016 3

A Broader Comparison

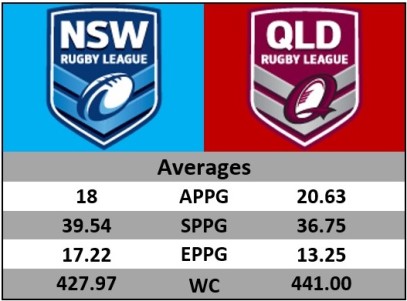
Over the years I have tried to find ways to compare teams on the whole and it has proven difficult, because the NRL is notoriously bad a releasing useful statistics. Below is a few statistics I use to compare how players. APPG = Attacking Plays Per Game which is the sum of Tries, Try Assists, Line Breaks, Line Break Assists, Forty Twenties and Forced Drop Outs, divided by total games; SPPG = Second Phase Per Game, which is the sum of Offloads and Tackle Breaks, divided by total games and EPPG = Errors Penalties Per Game, Which is as the name suggest the sum of Errors and Penalties divided by total games. Make of them what you will.
SOO G1 2016 4

The final figure WC is a new one I have been playing with to try and compare the whole team’s performance. WC stands for Weighted Contribution and it is a similar points system to Super Coach: however, every statistical category has been given a weighting on top of the points given, or taken away for each action. I have determined the weighting by going through 10 seasons of NRL team statistics and recording how often the top 8 teams in each category actually finished in the top 8 at the end of the season. The weighting or multiplication factor produced was from 0 to 1. For example over the 10 seasons 72% of the top Try scoring teams finished in the top 8; compared to offloads where only 47% of the top Offloading teams finished in the top 8. So in the final calculation Tries received a higher weighting then Offloads. So as in Super Coach each Try is worth 17 points and then when the multiplication factor of 0.7 is applied the Try is actually worth 11.9 points. The same applied to Offloads, each being worth 4 points and when the factor of 0.45 applied its worth drops just under 2 points. This process has been applied to all catagories and then added together. Another deviation from the Super Coach system is Metres and Runs have been included instead of 2 points per Hit Up greater than 8 metres and 1 point for less than 8 metres. Points taken away for errors and penalties have also increased, because I believe they are not appropriately weighted by Super Coach who only minus 2 points per Error and Penalty. I tested the figure against 10 NRL seasons to see how often the top 8 highest scoring teams finished in the end of season top 8 and roughly 75% of the top scoring teams finished in the top eight; not perfect, but not bad, there are allot of ways the figure can be improved. Using the WC figure QLD come out slightly ahead 441 to NSW 428. Let’s hope last year’s flogging was merely an anomaly and we get the contest Origin deserves.

For more stats visit Rugby League Stats
Johns v Thurston a statistical attempt

On Tuesday Fox Sports released an article attempting to compare Andrew Johns and Johnathan Thurston, by the numbers. The article only compared games, points, awards, titles, etc. In my opinion they could have done a better job. This article will attempt to go a little further.

Comparing these to great Halfbacks is no easy task, as I am not a statistician and do not have access to NRL stats databases. The stats I have managed to find on Andrew Johns are incomplete. The reason for this is the NRL did not start collecting detailed statistics (Line Breaks, Offloads, etc.) until 1998 and in the seasons that followed they increased in detail (Try Assists, Line Break Assists, etc.). Another issue with this comparison is the different stats providers, for example: all the stats I have for Andrew Johns were recorded by the NRL’s old stats provider Sports Data and the stats I have on Johnathan Thurston were recorded by Fox Sports. The reason I have not used Sports Data stats for JT is they are only available up till 2007. This is an issue because different stats providers have been shown to have differences in their records, for example: for the 2007 season Sports Data recorded 31 try assists and 19 offloads for Johnathan Thurston, while Fox Sports recorded 30 and 16 respectively. The issues mentioned above illuminates that this is a flawed attempt to compare the incomparable.

Screen Shot 2015-04-17 at 1.25.18 pm[Game statistics sourced from www.rugbyleagueproject.org]

They have each played 249 first grade games; Joey won 61.8% of games, including 2 premierships for Newcastle, while JT has won 53.8% of games across 2 clubs including 1 premiership. JT has taken part in 8 winning series for Queensland; winning 63.3% of games compared to Joey’s 5 series wins for NSW at 56.5%. As a side note: 16 of Joey’s 23 Origin appearances were at Halfback, while the other 7 were played at Hooker or off the bench. Joey won 87% of games for Australia, with 2 World Cup victories; while JT has won 93.5% of games for Australia with 1 World Cup victory.

Screen Shot 2015-04-17 at 1.25.25 pm[Award statistics sourced from www.rugbyleagueproject.org]

They are equal on top with 3 Dally M Medals a piece, in addition they have taken out 2 Golden Boots. JT has the edge on Dally M positional awards with 6 (3 at Halfback and 3 at 5-8) compared to Joeys 4 at Halfback. Joey claimed a Clive Churchill Medal in 2001, the only major award JT is without.

To this point we have covered all the basic stats that everyone already knows; we will now delve into the nitty gritty, starting with their attacking game.

JT V Joey[Andrew Johns Stats sourced from Sports Data’s NRLstats.com; Johnathan Thurston Stats Sourced from Fox Sports.]

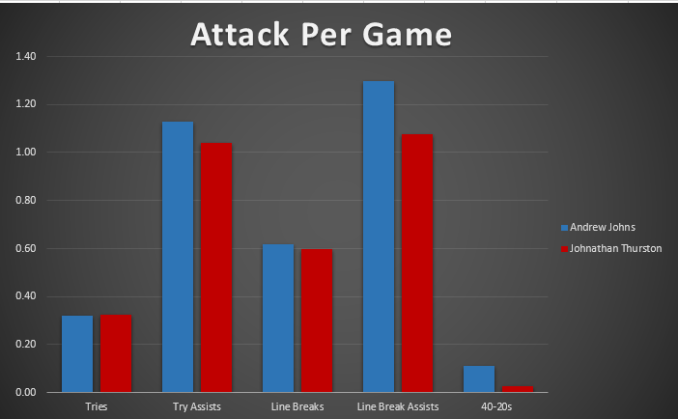
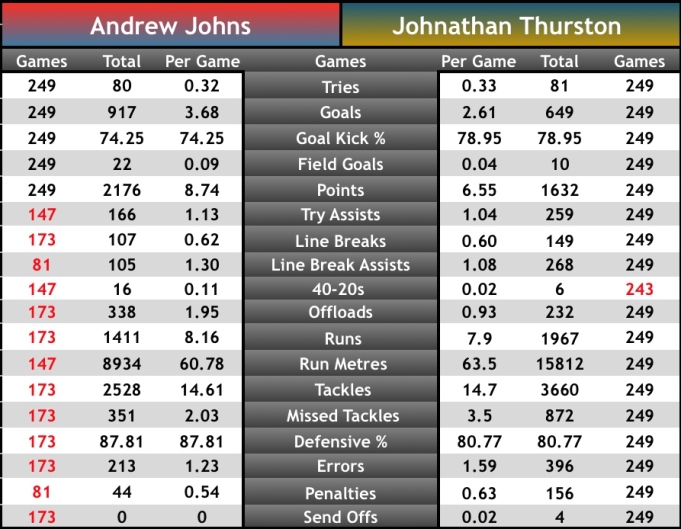
As discussed above the stats I found on Andrew Johns were incomplete, which makes this comparison unfair for both players. We of course have a complete record of Joey’s tries; scoring 80 from his 249 games compared to JT who has crossed the line 81 times from 249 games, a per game strike rate of 0.32 and 0.33 respectively. I only have try assist stats for 147 of Joey’s appearances, where he managed 166 at a strike rate of 1.13 per game. JT has assisted in 259 tries at a strike rate of 1.04 per game. Joey broke the line 107 times in the 173 games that were recorded, a strike rate of 0.62 per game; compared to 149 line breaks made by JT at 0.60 per game. Line Break Assists is the smallest sample I have on Johns as they were only recorded for 81 of his 249 appearances. In that period Joey assisted in 105 line breaks at a rate of 1.30 per game. JT has assisted 268 line breaks at a rate of 1.08 per game. Joey dominated when it came to forty twenties; kicking 16 from the 147 games recorded at 0.11 per game; compared to JT who has only managed 6 from 243 games (couldn’t find stats on a few finals games) at 0.02 per game.

Joey produced 338 offloads in the 173 games that they were recorded at 1.95 per game; compared to JT who has to date produced 232 offloads at 0.93 per game. Joey averaged 60.78 metres per game in the 147 that were recorded; compared to JT who has averaged 63.50 across his career. It’s fair to say that if we had complete stats on Joey’s career his per game averages would slide back towards JT’s numbers; however, how much is unclear as we are missing stats on years where he won a Premiership, a Dally M and a Halfback of the year award.

 Johns DefenceThurston Defence[Andrew Johns stats sourced from Sports Data from 173 of 249 games, Johnathan Thurston’s stats sourced from Fox Sports across 249 games = % (total tackles/total attempts displayed as percentage)]

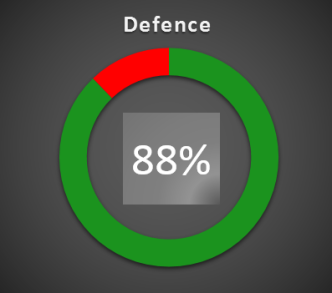
I found Defensive stats for 173 of Joey’s games where he averaged 14.61 tackles per game, missing 2.03 per game. JT‘s has averaged 14.70 tackles per game across his career averaging 3.50 misses. Fox Sports has JT’s effectiveness in defence at 75%; this must include ineffective tackles, which I could not find figures for. To be fair to JT I used the same simple formula that was used for Joey (total tackles made divided by total tackles attempted times 100). Using this simple method Joey made 88% of all tackles attempted compared to JT who has been 81% successful.

When it comes to errors and penalties the stats I found indicate that JT is slightly less disciplined. In the 173 games that errors were recorded, Joey made 213 at 1.23 per game, compared to JT who has made 396 errors at 1.59 per game. Penalties were only recorded for 81 of Joey’s games where he conceded 44 at 0.54 per game, compare to JT who has conceded 156 at 0.63 per game. In addition JT has also been sin binned on 4 occasions. I am not sure if Joey has ever been sent to the bin.

Screen Shot 2015-04-17 at 1.25.43 pm[Andrew Johns stats sourced from Sports Data; Johnathan Thurston’s stats sourced from Fox Sports. Highlighted red text means the data is incomplete. * Numbers have been derived from per game averages times the total games, therefore the figure will not be totally accurate.]

Numbers won’t settle the debate as people either love or hate these two players. From my perspective it has been fantastic watching these two magicians dominate over the years.

Fringe NRL halves making it in the Super League

Screen Shot 2014-08-10 at 8.55.07 am

I have collated the 2014 season statistics of 12 ex NRL halves who are currently playing in the English Super League.

NRL Halves make the move to England for various reason, like Travis Burns who made the move after a number of on field disciplinary issues or Sam Williams and Josh Drinkwater who made the move due to a lack of opportunities. Some try to return to the NRL, but few are successful, as was the case with Daniel Holdsworth, Michael Dobson and Michael Witt . It is rare for a top class NRL half to make the move, unless he is squeezed out due to salary cap, as Brett Finch was after the Melbourne salary cap scandal, or they may make the move towards the end of their career.

Travis Burns:

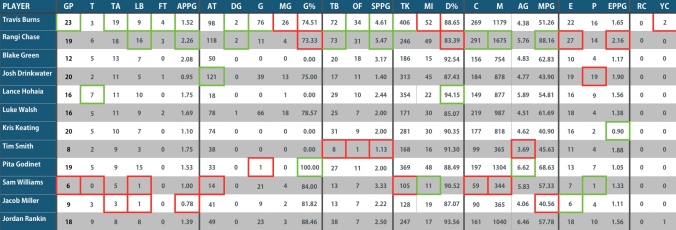
Played 127 NRL games for 3 clubs. Burns made the switch to Super League in 2013 after lengthy suspensions in 2012. He has lined up for Hull KR 23 times in 2014 and leads our list in try assists with 19, he also has the most offloads with 34 and forty twenties with 4. He has made the most tackles as well as missed the most of all other players on this list, making 406 tackles from 458 attempts at 88% successful. Burns has continued his bad boy reputation having spent 10 minutes in the bin twice in 2014.

Rangi Chase:

Played 32 NRL games for 2 clubs. Chase made the switch to Super League in 2009 after a lack of opportunities in the NRL. He has lined up for Salford 19 times in 2014 and leads this list in line breaks with 16,  tackle breaks with 73, carries with 291, metres with 1675, average metres with 88 per game and errors with 27. He is second in tries (6), try assists (18), forty twenties (3), offloads (31) and missed tackles (49). He is the most potent attacking half on the list averaging 2.16 Attacking Plays Per Game (APPG), followed by Blake Green (2.08 APPG), he is also the most active second phase half on our list averaging 5.47 SPPG, followed by Travis Burns (4.61 SPPG). Chase is the least disciplined half, with a defensive percentage of 83%, and an average of 2.16 Errors/Penalties Per Game (EPPG).

Blake Green:

Played 43 NRL games for 3 clubs and will make a comeback to the NRL in 2015 with the Melbourne Storm. He has only lined up 12 times for Wigan in 2014 and has amassed 5 tries, 13 try assists and 7 line breaks, averaging 2.08 APPG. He is solid in all areas of the game, averaging 3.17 SPPG, 92% in defence, has averaged 62 run metres per game and only 1.17 EPPG. If anyone can help in transition back to the NRL, Craig Bellamy can.

Josh Drinkwater:

Played 4 NRL games for the Saint George Dragons in 2013. He impressed in NYC leading the competition in try assists in 2012. He struggled to establish himself and was soon pushed back in the pecking order once Sam Williams another member of our list and Gareth Widdop where signed by the Dragons. He has lined up 20 times for the winless London Broncos in 2014 and has scored 2 tries, set up 11 and broke the line 5 times. He has conceded the most penalties with 19 and has been solid in defence (87% successful).

Lance Hohaia:

Played 185 NRL games for the NZ Warriors. Hohaia mad the move in 2012 to Saint Helens. He has lined up 16 times in 2014 and leads our list in tries with 7. Hohaia has set up 11 tries and cracked the line on 10 occasions. He is the most effective defender on our list at 94% successful. Hohaia was a solid NRL player and has moved to England to finish off his career.

Luke Walsh:

Played 120 NRL games for 2 clubs.  Walsh moved to the Super League in 2014 after he was pushed out of Penrith. He was underrated in the NRL averaging 2.7 Attacking Plays Per Game (APPG), Which includes line break assists and forced drop out, 2 statistics the Super League do not record. He has lined up 16 times for ladder leading Saint Helens and has scored 5 tries, set up 11, cracked the line 9 times and kicked 2 forty twenties, for an average of 1.69 APPG. He has been solid in defence at 85% and averaged over 60 run metres per game, which is 3 times as much as he did last year in the NRL.

Kris Keating:

Played 88 games in the NRL for 2 clubs including 2 grand final losses. He made the move to the Super League in 2014 after he was pushed out by Trent Hodkinson. Keating was one of the least potent attacking halves in the NRL, only averaging 1.33 APPG. He has lined up 20 times for Hull KR in 2014, scoring 5 tries, set up 10 and cracked the line 7 times. He has averaged over 90% in defence and gives away on average the fewest Errors/Penalties Per Game (EPPG) at 0.90.

Tim Smith:

Played 90 NRL games for 2 clubs. Smith was touted as the next big thing after he set up 40 tries in his debut season, earning the rookie of the year award. His NRL career fell apart after a string over alcohol related incidents, one of which involved the punching of the Australian Cricket captain Michael Clarke. He has had two stints in the Super League playing for 3 different clubs. He has only played 8 games for Wakefield in 2014, scoring 2 tries, setting up 9 and cracking the line 3 times. He is the worst second phase half on our list only averaging 1.13 SPPG, comprising of 8 tackle busts and 1 offload. He has been solid in defence at 91%.

Pita Godinet:

Played 18 NRL games for the NZ Warriors over 3 years and could never maintain a starting role. He made the move to Wakefield in 2014. He has lined up 19 times in 2014 and has scored 5 tries, set up 9 and broke the line 15 times. He averages 88% in defence and has the largest average carry of any member on our list, averaging 6.62 metres per carry.

Sam Williams:

Played 46 NRL games for 2 clubs and was pushed out of Saint George after Benji Marshall was signed. Williams was a solid half in the NRL averaging over 2 APPG and defended at 85%. He has lined up 6 timed for Catalans in 2014, setting up 5 tries and breaking the line once, he is the third best second phase half on this list, averaging 3.33 SPPG. Williams has been good in defence at 90% and is running for almost 60 metres a game. There is talk that he may be heading back to the NRL in 2015.

Jacob Miller:

Played 9 NRL games for the West Tigers and won a NYC premiership in 2012. He was also touted as the next big thing, but struggled at NRL level. He made the move to Hull FC mid way through 2013 after the emergence of Luke Brooks. He has lined up 9 times in 2014 and has produced meagre results in attack. He is the least potent half in attack on our list only averaging 0.78 APPG. Miller also averages the fewest run metres of any half on the list, at only 40 per game.

Jordan Rankin:

Played 17 NRL games for the Gold Coast Titans over 6 seasons. Rankin moved to Hull FC in 2014 and has had a solid first season. He has lined up 18 times in 2014 and has scored 9 tries, set up 8 and busted the line 8 times. He has busted 32 tackles, defended at 93% and averaged 58 run metres per game.

Most of these halves will never see the NRL again and any that do will most likely be on the Fringe. It will be interesting to see how Blake Green goes next year alongside some of the finest players to ever play the game.

For more Rugby League Stats please check out our Facebook page:
https://www.facebook.com/RLStats

2014 Prop Comparison

Screen Shot 2014-08-05 at 7.54.52 pm


After 21 rounds of the NRL competition the jury is still out on who has been the best Prop in 2014. There have been a number of standout performers, including but not limited to: Matt Scott, Corey Parker, Jesse Bromwich, James Graham, Aaron Woods, Josh McGuire and George Burgess.

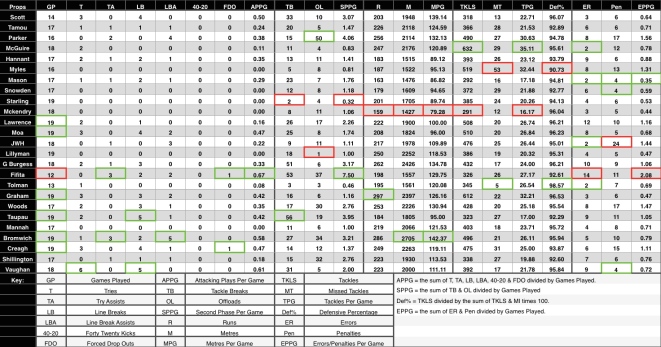
The ever improving Paul Vaughan has more tries and line breaks then all other props with 6 and 5 respectively. Martin Taupau also has 5 line breaks to his name. Jesse Bromwich has the most try and line breaks assists with 3 and 5 respectively. Andrew Fifita is equal in try assists with 3. Corey Parker has the second most line break assists with 4. Andrew Fifita has been stifled by injury for most of the season, but he averages more attacking plays per game then any other Prop at 0.67 APPG.

Andrew Fifita is also the king of second phase averaging 7.5 SPPG (Parker second with 4.06 SPPG), including 53 tackle breaks and 37 offloads. He is second in both tackle bust and offloads, behind Martin Taupau with 56 tackle breaks and Corey Parker with 50 offloads. Meat and Potatoes Prop Josh Starling is the least active Prop when it comes to second phase only averaging 0.32 SPPG, including 2 tackle breaks and 4 offloads.

Jesse Bromwich is the biggest metre eater so far in 2014, running 286 timed for 2705 metres at 143 metres per game. James Graham has ran the most hit ups with 297, George Burgess has ran the second most metres with 2426 and Matt Scott has the second best average metres per game, running 139 per game. Sam McKendry runs the least metres per game of all Props on this list, running for just under 80 per game.

Josh McGuire has made more tackles then all other props in 2014 with 632 at 35 a game. Aiden Tolman is the most effective Prop in defence, he has 345 tackles from 350 attempts at 98%. Nate Myles has missed the most tackles with 53, making him the least effective prop on this list. Myles has made 519 tackles from 572 attempts at just over 90%.

The trend of potency in attack leading to a higher error rate continues. Andrew Fifita the best Prop in attack is also the least disciplined making on average 2.08 Errors/Penalties Per Game (EPPG), he has the most errors with 15 and has 11 penalties. JWH is them most penalised Prop in 2014 with 24 to his name. Reformed bad boy Willie Mason is the most disciplined at 0.35 EPPG, including 2 errors and 4 penalties.

Best by the Numbers: Jesse Bromwich (rates high in all areas and has no downsides)

Worst by the Numbers: Nate Myles (surprising, but has high error rate, worst defence, doesn’t average over a hundred metres a game, averages under one second phase play and has not registered a single attacking play in 2014)

For more Rugby League Statistics check out our Facebook page:

https://www.facebook.com/RLStats

2014 Lock Comparison

Screen Shot 2014-08-05 at 7.54.44 pm

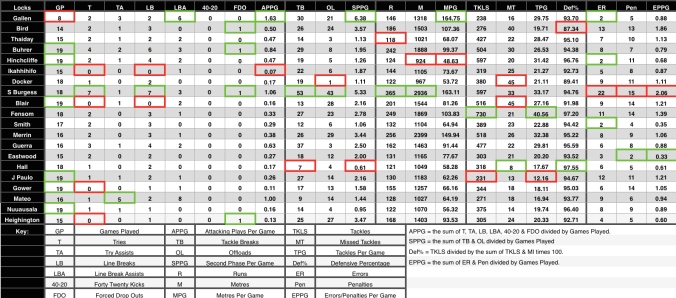
Corey Parker’s move to the front row has narrowed the competition for the title of the NRL’s best Lock. Paul Gallen and Sam Burgess appear to be the only real contenders for this title. They are easily the most potent in attack,  Burgess leads the tries and line breaks with 7 a piece and Gallen leads line break assists with 6. Gallen averages 1.63 Attacking Plays Per Game (APPG), this is significantly more then Burgess who averages 1.06 APPG. Feleti Mateo leads the try assists with 5 and is a close third in APPG at 1.00. The Warriors Sebastine Ikahihifo is the least potent lock when it comes to attack in 2014 only averaging 0.07 APPG.

Burgess and Gallen also lead all other Locks by some margin in second phase play. Sam has registered 53 tackle busts and 43 offloads in 2014. The next closest Lock has 16 less tackle busts and 14 less offloads. Gallen has only played 8 games in 2014 so he has significantly less game time then Burgess, however he averages more Second Phase Per Game (SPPG), averaging 6.38 to Sam’s 5.33. Glen Hall with only 7 tackle bust and 4 offloads is worst second phase lock in 2014. This only gives him an average of 0.61 SPPG.

Burgess and Gallen comfortably average the most metres per game, averaging a staggering 163 and 164 metres respectively. Trent Merrin comes in third at 150 metres per game. Sam Burgess has ran 365 times for 2936 metres. This is over 100 carries and 500 metres more then any other Lock. Ryan Hinchcliffe averaging 48 metres a game is the least active running lock this season.

Work Horse Shaun Fensom has racked up 730 tackles in 2014, 130 more then Sam Burgess and Ryan Hinchcliffe who have each made 597. Shaun averages over 40 tackles a game and has only missed 21 all season. This makes him 97.20% effective in defence. Only Glenn Hall has a better percentage with 97.55, however he averages 23 less tackles a game then Fensom. Only Greg Bird (87.34%) and Adam Docker (89.41%) are less then 90% effective in defence.

When it comes to discipline Sam Burgess is easily the worst offender with the most penalties (15) and errors (22). This gives him an average of 2.06 Errors/Penalties Per Game (EPPG) Greg Bird is nipping at his heals at 1.86 EPPG. Greg Eastwood with 3 penalties and 2 errors is the most disciplined Lock, averaging on 0.33 EPPG.

Best by the numbers: Paul Gallen, just gets over the top of Sam due to his poor discipline.

Worst by the numbers: Adam Docker, average in all areas of the game.

For more Rugby League Statistics check out our Facebook page

https://www.facebook.com/RLStats

2014 Halfback Comparison

2014 Halfback comparison up to RND 17.


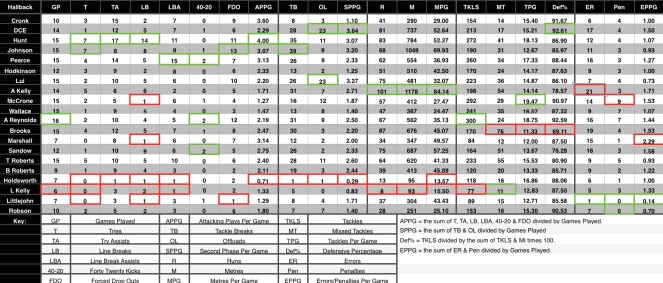
After 17 rounds of competition few would have predicted Ben Hunt to be the dominant Halfback in the competition. He currently leads the Dally M and is the dominant attacking number 7 in the competition. He leads all other Halfbacks in Tries (7), Try Assists (17), and Line Breaks (14). He is second in Line Break Assists (11) and third in Forced Drop Outs (11). He averages 4.00 Attacking Plays Per Game (APPG), followed by Copper Cronk (3.60), Benji Marshall  (3.14), Mitchell Pearce (3.13), and Shaun Johnson (3.07). No other Halfback averages over 3.00. Daniel Holdsworth has proved to be the worst attacking Halfback in the competition, averaging only 0.71 APPG. He is the only Halfback to average below 1.00.

Shaun Johnson has broken more tackles then any other Halfback this year with 39 to his name. He leads Ben Hunt with 35, Albert Kelly equal with Adam Reynolds on 31 and Luke Brooks with 30. No other Halfback has broken over 30 tackles so far this year. DCE and Robert Lui are the only Halfbacks with over 20 Offloads to their name so far in 2014 with 23 apiece. DCE is the leading second phase Halfback, averaging 3.64 SPPG. DCE leads a close following pack consisting of Robert Lui (3.27), Shaun Johnson (3.20) and Ben Hunt (3.07). No other number 7s average over 3.00 SPPG. Daniel Holdsworth again sits alone at the bottom when it comes to second phase averaging only 0.29 SPPG.

Albert Kelly leads the way in Runs (101), Metres (1178), and Metres Per Game (84.14). Shaun Johnson is the only other Halfback to have cracked a thousand metres this year and to average over 60 metres per game. Johnson has ran for 1049 metres at 69.93 MPG. Daniel Holdsworth makes it 3 from 3 at the wrong end of the scale. He has ran for a pathetic 13.57 MPG in 2014.

Adam Reynolds has made more tackles then any other Halfback in 2014 with an even 300 to his name. Josh McCrone sits second with 292, and Ben Hunt third with 272. DCE is the most effective defending Halfback with a percentage of 92.61. He is hotly pursued by Adam Reynolds (92.59%), Cooper Cronk (91.67%), Josh McCrone (90.97%), and Jeff Ronson (90.53%). No other Halfback averages above 90%. Rookie 19 year old Luke Brooks has opened up a gap of 20 missed tackles to the nearest offender. He has missed 76 tackles so far in 2014. All these missed tackles has left him only 69.11% effective in defence. Brooks is the only Halfback to average less them 75% in defence.

In 7 appearances Jack Littlejohn has only made one error and conceded no penalties, giving him and outstanding average of 0.14 Errors/Penalties Per Game (EPPG). Only Littlejohn along with Jeff Robson (0.70), Tyrone Roberts (0.93), and Shaun Johnson (0.93) average less then 1.00 EPPG. Benji Marshall 2014 comeback tour has yielded more errors per game then any other Halfback at 2.29 EPPG. No other Halfback averages over 2.00 EPPG.

Best Attacking Halfback: Ben Hunt,

Most Consistant Halfback: Ben Hunt,

Worst Halfback: Daniel Holdsworth.

A special mention to Shaun Johnson along with Ben Hunt who each average over 3 APPG, 3 SPPG, over 50 MPG, defend above 85% and only average around 1 EPPG.

If Ben Hunt goes only to win the Dally M in 2014 it would cap of an incredible coming of age for Hunt. He will have finally proved his potential in the top grade after he was heralded as the next big thing way back in 2008, when he won the NYC inaugural player of the year in 2008.

For more stats check out.

http://www.facebook.com/rlstats/

2014 Hooker Comparison

Screen Shot 2014-07-09 at 10.46.12 pm


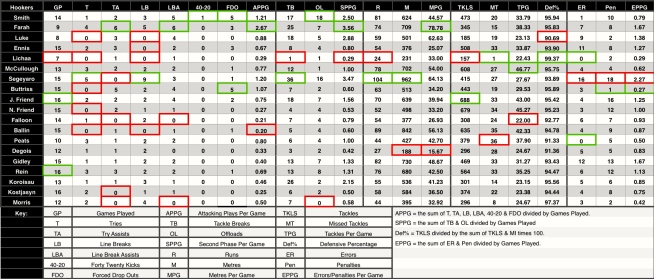
Robbie Farah has been the dominate attacking Hooker so far in 2014. He leads the way in Attack, Second Phase and Metres Per Game.

Jame Segeyaro leads the pack in Tries (5) and Line Breaks (9) followed by Robbie Farah with 4 Tries and 5 Line Breaks. Farah Leads in Try Assists (6) and Line Break Assists (6). Cameron Smith is the only Hooker on this list to kick a 40-20 this year; he also leads the Forced Drop Outs (FDO) with Glen Buttriss with 5 apiece. Robbie Farah is averaging 2.67 Attacking Plays Per Game (APPG), followed by Cameron Smith, James Segeyaro and Glen Buttriss averaging 1.21, 1.20 and 1.07 respectively. Matt Ballin has proved to be the least dynamic Hooker in attack, only averaging 0.20 APPG.

James Segeyaro leads the way in Tackle Breaks with 36, followed by Koroisau and Farah with 26 and 25 respectively. Cameron Smith has recorded the most Offloads so far in 2014 with 18, followed by Segeyaro with 16. No other hooker has recorded over 10. Robbie Farah averages the most Second Phase Per Game (SPPG) at 3.56, followed by Segeyaro 3.47 and Luke 2.88. The much talked about Michael Lichaa brings up the rear when it comes to SPPG. Averaging only 0.29. Lack of minutes per game and finding his feet in first grade is a contributing factor to his poor average.

James Segeyaro again leads the way in runs and metres with 104 for 962 metres, followed by Matt Ballin with 89 for 842 metres and Kurt Gidley with 82 for 730 metres. Robbie Farah averages the most Metres Per Game (MPG) with 78.78, followed by Segeyaro at 64.13 per game and Luke at 62.63 per game.  Isaac DeGois is the least prolific running frontline Hooker in the NRL in 2014 with a poor average of 15.67 metres per game.

Jake Friend leads the way tackling with 688 to his name followed by Nathan Friend with 679 and Andrew McCullough with 608. Andrew McCullough is the hardest working defender averaging 46.77 tackles per game, followed by Nathan Friend at 45.27 and Jake Friend 43.00. Michael Lichaa has only missed one tackle in 158 attempts so far in 2014 giving him the best defensive percentage in the NRL at 99.37, followed by John Morris 97.37 and Cameron Smith 95.94. Isaac Luke is the least effective defending hooker, with a percentage of 90.69.

Glen Buttriss is the most disciplined Hooker so far in 2014, producing only 0.27 Errors/Penalties Per Game (EPPG). James Segeyaro is by far the worst offender averaging 2.27 EPPG.

Best Attacker: Robbie Farah,

Most Consistent: Robbie Farah,

Worst Hooker: Isaac Degois.

James Segeyaro recently became the Panthers fulltime Hooker. If trends continue I think he will become the most dangerous attacking Hooker in the NRL.


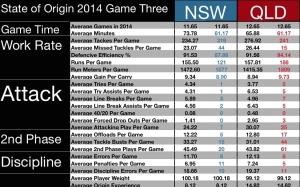
Game 3 comparison

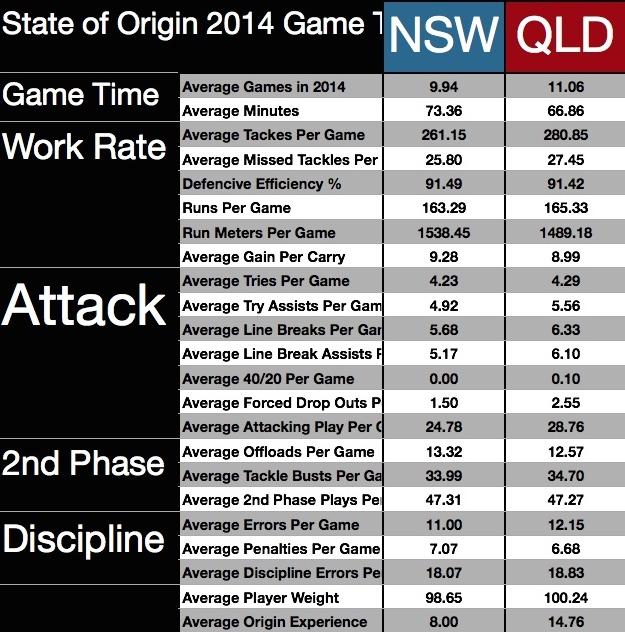
Here is how the teams compare for  Game 3. Cooper Cronk’s return has tipped the balance of power in attack to the Maroons.