Terry Campese Then and Now

Terry Campese was told this week that he was no longer guaranteed a spot in first grade. He now seems destined to play out his contract for Mounties in NSW Cup or perhaps, or perhaps he may receive an offer from Super League, Canberra however may not be interested in topping up his wage. Since the initial injury sustained in the 2010 finals series, the one time Australian & NSW pivot has failed to recapture the stellar form he displayed from 2008 to 2010. He has only managed 43 games in the past 4 seasons, as opposed to the 87 in the 4 seasons prior to his string of injuries. Of the 43 games he has lined up for since the 2010 injury, he has only seen 17 victories at 39.5%, as opposed to the 47% success rate between 2008-2010, where Canberra made the finals on 2 occasions (2008 & 2010). 

Screen Shot 2014-08-17 at 8.55.27 pm

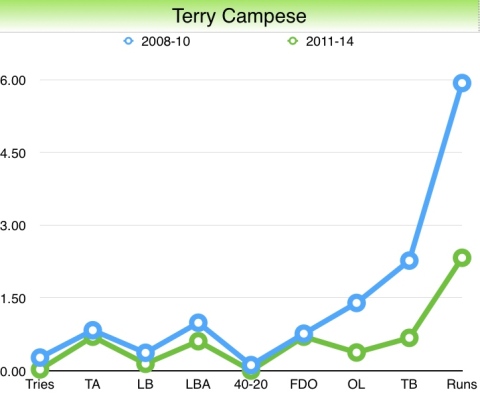
Terry’s attacking stats since 2010 have seen a reduction in all areas, most noticably his running game.  Prior to the injury Terry was running on average 6 times a game for 50 metres, from 2011 onwards he has only been running the ball slightly over 2 times a game for under 20 metres. Terry’s diminished running game has had a flow on effect to all other areas of his game, his ability to produce second phase plays has dropped dramatically. Between 2008-10 Campese would on average offload 1.4 times a game and break 2.3 tackles. Since 2010 he has only managed 0.4 offloads per game and 0.7 tackle breaks. 

Screen Shot 2014-08-17 at 9.08.16 pm

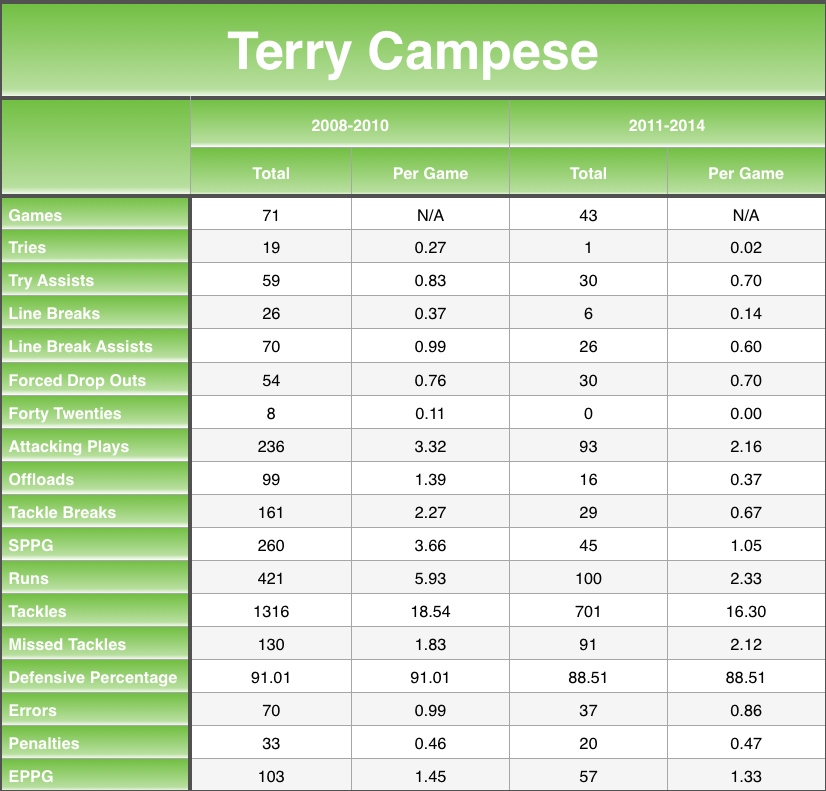
Terry’s defence has also suffered post injury, possibly due to a reduced ability to move laterally fast enough in response to changing attack. Between 2008-10, he averaged 18.5 tackles per game, only missing 1.8 on average, a success rate of 91%. This percentage was better then many back rowers playing the game and was on par with John Sutton. Since the injury Terry has averaged 16.3 tackles per game missing 2.1 on average, a success rate of 88%. This percentage is still high for a half, but is statistically significant.

Screen Shot 2014-08-18 at 9.33.21 am

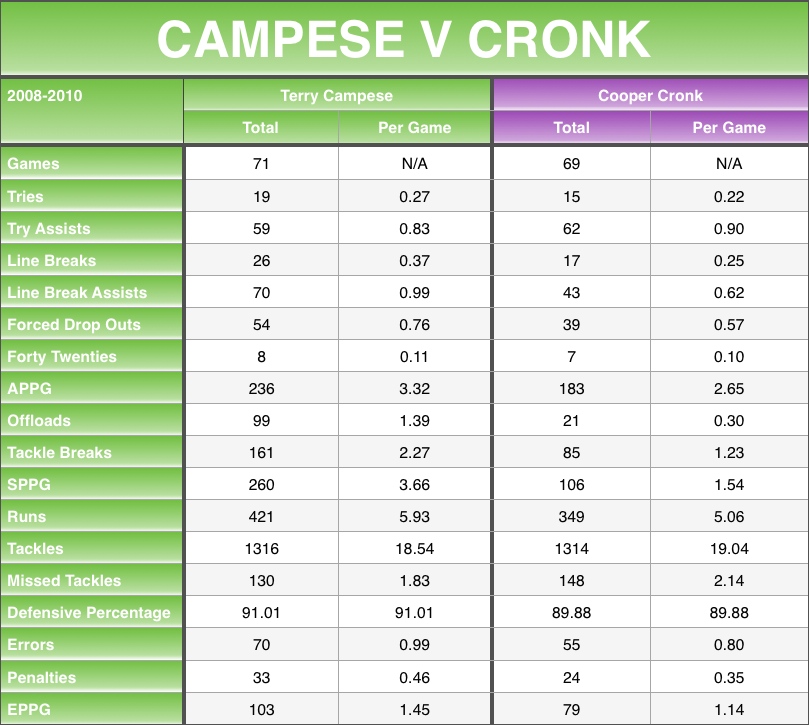
Above and below are comparisons of regular season form between Cooper Cronk and Terry Campese from 2008 to 2010. These comparisons help to illustrate the kind of player Terry Campese was and only begs the question how good could he have been if not for a horrible string of injuries. Keep in mind these are only the raw numbers of a Five Eighth and Halfback, but both where the dominant halves for their club during this period. During this period Cooper only out pointed Terry in Try Assists, Errors and Penalties. Terry averaged more Try’s, Line Breaks, Line Break Assists, Forty Twenties, Forced Drop Outs, Offloads, Tackle Busts, he missed fewer tackles and had a higher defensive success rate. 

Screen Shot 2014-08-18 at 9.35.44 am

Injury has robbed Terry Campese the opportunity to ever fulfil his full potential. Frustrated Canberra fans have had enough of losing and many blame Terry for not reaching his former heights and for taking up so much of the Salary cap, however it is not his fault Canberra decided to sign him on such a lucrative deal after he sustained the devastating injury, that mistake is on the Raiders administration. Lets hope he can see out the rest of his career injury free, enjoying what time on the paddock he has left. 

For more Rugby League Stats please check out the Facebook page:

https://www.facebook.com/RLStats

JARRYD HAYNE’S REGULAR SEASON FORM SINCE 2009

Screen Shot 2014-08-12 at 10.05.10 am

This is a quick breakdown of Jarryd Hayne’s statistics from 2009 to the present. His worst year was was 2013 under Ricky Stuart. 

Check out our Facebook page for more Rugby League Stats:

https://www.facebook.com/RLStats

2014 Prop Comparison

Screen Shot 2014-08-05 at 7.54.52 pm


After 21 rounds of the NRL competition the jury is still out on who has been the best Prop in 2014. There have been a number of standout performers, including but not limited to: Matt Scott, Corey Parker, Jesse Bromwich, James Graham, Aaron Woods, Josh McGuire and George Burgess.

The ever improving Paul Vaughan has more tries and line breaks then all other props with 6 and 5 respectively. Martin Taupau also has 5 line breaks to his name. Jesse Bromwich has the most try and line breaks assists with 3 and 5 respectively. Andrew Fifita is equal in try assists with 3. Corey Parker has the second most line break assists with 4. Andrew Fifita has been stifled by injury for most of the season, but he averages more attacking plays per game then any other Prop at 0.67 APPG.

Andrew Fifita is also the king of second phase averaging 7.5 SPPG (Parker second with 4.06 SPPG), including 53 tackle breaks and 37 offloads. He is second in both tackle bust and offloads, behind Martin Taupau with 56 tackle breaks and Corey Parker with 50 offloads. Meat and Potatoes Prop Josh Starling is the least active Prop when it comes to second phase only averaging 0.32 SPPG, including 2 tackle breaks and 4 offloads.

Jesse Bromwich is the biggest metre eater so far in 2014, running 286 timed for 2705 metres at 143 metres per game. James Graham has ran the most hit ups with 297, George Burgess has ran the second most metres with 2426 and Matt Scott has the second best average metres per game, running 139 per game. Sam McKendry runs the least metres per game of all Props on this list, running for just under 80 per game.

Josh McGuire has made more tackles then all other props in 2014 with 632 at 35 a game. Aiden Tolman is the most effective Prop in defence, he has 345 tackles from 350 attempts at 98%. Nate Myles has missed the most tackles with 53, making him the least effective prop on this list. Myles has made 519 tackles from 572 attempts at just over 90%.

The trend of potency in attack leading to a higher error rate continues. Andrew Fifita the best Prop in attack is also the least disciplined making on average 2.08 Errors/Penalties Per Game (EPPG), he has the most errors with 15 and has 11 penalties. JWH is them most penalised Prop in 2014 with 24 to his name. Reformed bad boy Willie Mason is the most disciplined at 0.35 EPPG, including 2 errors and 4 penalties.

Best by the Numbers: Jesse Bromwich (rates high in all areas and has no downsides)

Worst by the Numbers: Nate Myles (surprising, but has high error rate, worst defence, doesn’t average over a hundred metres a game, averages under one second phase play and has not registered a single attacking play in 2014)

For more Rugby League Statistics check out our Facebook page:

https://www.facebook.com/RLStats