Terry Campese Then and Now

Terry Campese was told this week that he was no longer guaranteed a spot in first grade. He now seems destined to play out his contract for Mounties in NSW Cup or perhaps, or perhaps he may receive an offer from Super League, Canberra however may not be interested in topping up his wage. Since the initial injury sustained in the 2010 finals series, the one time Australian & NSW pivot has failed to recapture the stellar form he displayed from 2008 to 2010. He has only managed 43 games in the past 4 seasons, as opposed to the 87 in the 4 seasons prior to his string of injuries. Of the 43 games he has lined up for since the 2010 injury, he has only seen 17 victories at 39.5%, as opposed to the 47% success rate between 2008-2010, where Canberra made the finals on 2 occasions (2008 & 2010). 

Screen Shot 2014-08-17 at 8.55.27 pm

Terry’s attacking stats since 2010 have seen a reduction in all areas, most noticably his running game.  Prior to the injury Terry was running on average 6 times a game for 50 metres, from 2011 onwards he has only been running the ball slightly over 2 times a game for under 20 metres. Terry’s diminished running game has had a flow on effect to all other areas of his game, his ability to produce second phase plays has dropped dramatically. Between 2008-10 Campese would on average offload 1.4 times a game and break 2.3 tackles. Since 2010 he has only managed 0.4 offloads per game and 0.7 tackle breaks. 

Screen Shot 2014-08-17 at 9.08.16 pm

Terry’s defence has also suffered post injury, possibly due to a reduced ability to move laterally fast enough in response to changing attack. Between 2008-10, he averaged 18.5 tackles per game, only missing 1.8 on average, a success rate of 91%. This percentage was better then many back rowers playing the game and was on par with John Sutton. Since the injury Terry has averaged 16.3 tackles per game missing 2.1 on average, a success rate of 88%. This percentage is still high for a half, but is statistically significant.

Screen Shot 2014-08-18 at 9.33.21 am

Above and below are comparisons of regular season form between Cooper Cronk and Terry Campese from 2008 to 2010. These comparisons help to illustrate the kind of player Terry Campese was and only begs the question how good could he have been if not for a horrible string of injuries. Keep in mind these are only the raw numbers of a Five Eighth and Halfback, but both where the dominant halves for their club during this period. During this period Cooper only out pointed Terry in Try Assists, Errors and Penalties. Terry averaged more Try’s, Line Breaks, Line Break Assists, Forty Twenties, Forced Drop Outs, Offloads, Tackle Busts, he missed fewer tackles and had a higher defensive success rate. 

Screen Shot 2014-08-18 at 9.35.44 am

Injury has robbed Terry Campese the opportunity to ever fulfil his full potential. Frustrated Canberra fans have had enough of losing and many blame Terry for not reaching his former heights and for taking up so much of the Salary cap, however it is not his fault Canberra decided to sign him on such a lucrative deal after he sustained the devastating injury, that mistake is on the Raiders administration. Lets hope he can see out the rest of his career injury free, enjoying what time on the paddock he has left. 

For more Rugby League Stats please check out the Facebook page:

https://www.facebook.com/RLStats

Sam Tomkins Boom or Bust in the NRL

Screen Shot 2014-08-11 at 11.48.27 am

Sam Tomkins made the brave move to leave his beloved club Wigan and take on the NRL in 2014. He left the English Super League having achieved it all, he won two Premierships 2010 & 2013, two Challenge Cups 2011 & 2013 and was named player of the year (Man of Steel) in 2012. Sam has represented England on 25 occasions scoring 21 tries. He played 129 Super League matches, winning 100, giving him the ridiculous winning percentage of 77.5%. To put it into perspective Cameron Smith’s winning percentage in slightly below 70% and he has played for the most dominant team of the last decade. Of course the Super League is not a competitive as the NRL. For example the bottom placed London Broncos have lost all 23 games in 2014, while bottom placed Canberra and Cronulla have each won 5.

The New Zealand Warriors had to pay a world record transfer fee of 700,000 pounds to acquire Tomkins from Wigan. His arrival signalled the beginning of the end for talented Fullback Kevin Locke’s association with the Warriors, has Sam been worth or the fuss and money?

Screen Shot 2014-08-11 at 11.51.04 am

By the numbers Sam Tomkins as played in all 20 games for the Warriors in 2014 and won 11, a winning percentage of 55%. He has scored 10 tries, set up 9, broke the line 12 times, assisted in 16 line breaks and forced 4 drop outs. His strike rate is down in all departments when compared to his numbers in Super League but that is to be expected. Super League do not record line break assists or forced drop outs, so I cannot get an accurate figure on attacking plays per game, on the stats available its 2.7, so you could safely estimate somewhere around 3.5 to 4 APPG.

In the NRL Sam has produced 2.6 Attacking Plays Per Game (APPG), on par with Brett Stewart, Greg Inglis and only slightly below Billy Slater with 2.8 APPG. Surprise packet Michael Morgan is in killer form averaging 3.3 APPG, but man of the year Jarryd Hayne is sitting pretty on top with 4.1 APPG. These numbers indicate that in attack Tomkins has not been outclassed and can match it with some of the biggest names in the NRL. As a side note gun young Fullback Anthony Milford who is not included in the picture above has averaged 2.75 APPG in 2014.

Sam has broken 79 tackles and offloaded 14 times in 2014, giving him an average of 4.7 Second Phase Per Game (SPPG), a higher rate then Brett Stewart (2.9 SPPG), Michael Morgan (3.6 SPPG) and Billy Slater (4.3 SPPG). Of the Fullbacks shown above only Greg Inglis (4.9 SPPG) and Jarryd Hayne (7.1 SPPG) are more proactive when it comes to second phase. Anthony Milford has averaged 6.25 SPPG.

Sam has run 258 times for 2074 metres at 103.7 per game. This is only slightly less then his average run metres in Super League (110.5) and is a solid contribution. He averages more metres then Brett Stewart (89.4) and Michael Morgan (100.9). Billy Slater (117.4), Greg Inglis (143.6) and Jarryd Hayne (174.2) have run for significantly more metres. Anthony Milford has averaged 104.65 metres per game.

In defence Tomkins has been impressive given his diminutive stature. He has made 104 tackles from 130 attempts at 80% successful. 80% is a very good percentage for a NRL fullback. Hayne, Slater, Inglis and Stewarts career average in the position are all slightly below or above 80%. In Super League Sam defended at 88% successful, I have not seen any NRL Fullback do this for an extended period of time. His defence in 2014 has been better then Jarryd Hayne’s (75.31), Billy Slater’s (76.99) and Brett Stewarts (79.52). Michael Morgan (86.92) and Greg Inglis (88.89) are at a new level when it comes to defending at fullback in 2014. Anthony Milford’s has been defending at 65.77% in 2014.

When it comes to discipline Sam has made 26 errors and given away 7 penalties for an average of 1.7 Errors/Penalties Per Game (EPPG), 0.4 more then his average in the Super League. This is a better rate then Billy Slater and Jarryd Hayne, who both average 1.9 EPPG, but significantly worse then Michael Morgan (1.5), Brett Stewart (1.0) and Greg Inglis (0.6). Anthony Milford has averaged 1.3 EPPG.

In conclusion Sam Tomkins first year in the world’s hardest Rugby League competition has been a success. He has matched it with some of the biggest names and shown he is up for the challenge. It’s good to see a quality English player come to Australia in their prime and have a crack. It’s a shame we shall never see the likes of James Roby or Kevin Sinfield run around the NRL.

For more Rugby League Stats please check out our Facebook Site:

https://www.facebook.com/RLStats


Fringe NRL halves making it in the Super League

Screen Shot 2014-08-10 at 8.55.07 am

I have collated the 2014 season statistics of 12 ex NRL halves who are currently playing in the English Super League.

NRL Halves make the move to England for various reason, like Travis Burns who made the move after a number of on field disciplinary issues or Sam Williams and Josh Drinkwater who made the move due to a lack of opportunities. Some try to return to the NRL, but few are successful, as was the case with Daniel Holdsworth, Michael Dobson and Michael Witt . It is rare for a top class NRL half to make the move, unless he is squeezed out due to salary cap, as Brett Finch was after the Melbourne salary cap scandal, or they may make the move towards the end of their career.

Travis Burns:

Played 127 NRL games for 3 clubs. Burns made the switch to Super League in 2013 after lengthy suspensions in 2012. He has lined up for Hull KR 23 times in 2014 and leads our list in try assists with 19, he also has the most offloads with 34 and forty twenties with 4. He has made the most tackles as well as missed the most of all other players on this list, making 406 tackles from 458 attempts at 88% successful. Burns has continued his bad boy reputation having spent 10 minutes in the bin twice in 2014.

Rangi Chase:

Played 32 NRL games for 2 clubs. Chase made the switch to Super League in 2009 after a lack of opportunities in the NRL. He has lined up for Salford 19 times in 2014 and leads this list in line breaks with 16,  tackle breaks with 73, carries with 291, metres with 1675, average metres with 88 per game and errors with 27. He is second in tries (6), try assists (18), forty twenties (3), offloads (31) and missed tackles (49). He is the most potent attacking half on the list averaging 2.16 Attacking Plays Per Game (APPG), followed by Blake Green (2.08 APPG), he is also the most active second phase half on our list averaging 5.47 SPPG, followed by Travis Burns (4.61 SPPG). Chase is the least disciplined half, with a defensive percentage of 83%, and an average of 2.16 Errors/Penalties Per Game (EPPG).

Blake Green:

Played 43 NRL games for 3 clubs and will make a comeback to the NRL in 2015 with the Melbourne Storm. He has only lined up 12 times for Wigan in 2014 and has amassed 5 tries, 13 try assists and 7 line breaks, averaging 2.08 APPG. He is solid in all areas of the game, averaging 3.17 SPPG, 92% in defence, has averaged 62 run metres per game and only 1.17 EPPG. If anyone can help in transition back to the NRL, Craig Bellamy can.

Josh Drinkwater:

Played 4 NRL games for the Saint George Dragons in 2013. He impressed in NYC leading the competition in try assists in 2012. He struggled to establish himself and was soon pushed back in the pecking order once Sam Williams another member of our list and Gareth Widdop where signed by the Dragons. He has lined up 20 times for the winless London Broncos in 2014 and has scored 2 tries, set up 11 and broke the line 5 times. He has conceded the most penalties with 19 and has been solid in defence (87% successful).

Lance Hohaia:

Played 185 NRL games for the NZ Warriors. Hohaia mad the move in 2012 to Saint Helens. He has lined up 16 times in 2014 and leads our list in tries with 7. Hohaia has set up 11 tries and cracked the line on 10 occasions. He is the most effective defender on our list at 94% successful. Hohaia was a solid NRL player and has moved to England to finish off his career.

Luke Walsh:

Played 120 NRL games for 2 clubs.  Walsh moved to the Super League in 2014 after he was pushed out of Penrith. He was underrated in the NRL averaging 2.7 Attacking Plays Per Game (APPG), Which includes line break assists and forced drop out, 2 statistics the Super League do not record. He has lined up 16 times for ladder leading Saint Helens and has scored 5 tries, set up 11, cracked the line 9 times and kicked 2 forty twenties, for an average of 1.69 APPG. He has been solid in defence at 85% and averaged over 60 run metres per game, which is 3 times as much as he did last year in the NRL.

Kris Keating:

Played 88 games in the NRL for 2 clubs including 2 grand final losses. He made the move to the Super League in 2014 after he was pushed out by Trent Hodkinson. Keating was one of the least potent attacking halves in the NRL, only averaging 1.33 APPG. He has lined up 20 times for Hull KR in 2014, scoring 5 tries, set up 10 and cracked the line 7 times. He has averaged over 90% in defence and gives away on average the fewest Errors/Penalties Per Game (EPPG) at 0.90.

Tim Smith:

Played 90 NRL games for 2 clubs. Smith was touted as the next big thing after he set up 40 tries in his debut season, earning the rookie of the year award. His NRL career fell apart after a string over alcohol related incidents, one of which involved the punching of the Australian Cricket captain Michael Clarke. He has had two stints in the Super League playing for 3 different clubs. He has only played 8 games for Wakefield in 2014, scoring 2 tries, setting up 9 and cracking the line 3 times. He is the worst second phase half on our list only averaging 1.13 SPPG, comprising of 8 tackle busts and 1 offload. He has been solid in defence at 91%.

Pita Godinet:

Played 18 NRL games for the NZ Warriors over 3 years and could never maintain a starting role. He made the move to Wakefield in 2014. He has lined up 19 times in 2014 and has scored 5 tries, set up 9 and broke the line 15 times. He averages 88% in defence and has the largest average carry of any member on our list, averaging 6.62 metres per carry.

Sam Williams:

Played 46 NRL games for 2 clubs and was pushed out of Saint George after Benji Marshall was signed. Williams was a solid half in the NRL averaging over 2 APPG and defended at 85%. He has lined up 6 timed for Catalans in 2014, setting up 5 tries and breaking the line once, he is the third best second phase half on this list, averaging 3.33 SPPG. Williams has been good in defence at 90% and is running for almost 60 metres a game. There is talk that he may be heading back to the NRL in 2015.

Jacob Miller:

Played 9 NRL games for the West Tigers and won a NYC premiership in 2012. He was also touted as the next big thing, but struggled at NRL level. He made the move to Hull FC mid way through 2013 after the emergence of Luke Brooks. He has lined up 9 times in 2014 and has produced meagre results in attack. He is the least potent half in attack on our list only averaging 0.78 APPG. Miller also averages the fewest run metres of any half on the list, at only 40 per game.

Jordan Rankin:

Played 17 NRL games for the Gold Coast Titans over 6 seasons. Rankin moved to Hull FC in 2014 and has had a solid first season. He has lined up 18 times in 2014 and has scored 9 tries, set up 8 and busted the line 8 times. He has busted 32 tackles, defended at 93% and averaged 58 run metres per game.

Most of these halves will never see the NRL again and any that do will most likely be on the Fringe. It will be interesting to see how Blake Green goes next year alongside some of the finest players to ever play the game.

For more Rugby League Stats please check out our Facebook page:

https://www.facebook.com/RLStats

2014 Prop Comparison

Screen Shot 2014-08-05 at 7.54.52 pm


After 21 rounds of the NRL competition the jury is still out on who has been the best Prop in 2014. There have been a number of standout performers, including but not limited to: Matt Scott, Corey Parker, Jesse Bromwich, James Graham, Aaron Woods, Josh McGuire and George Burgess.

The ever improving Paul Vaughan has more tries and line breaks then all other props with 6 and 5 respectively. Martin Taupau also has 5 line breaks to his name. Jesse Bromwich has the most try and line breaks assists with 3 and 5 respectively. Andrew Fifita is equal in try assists with 3. Corey Parker has the second most line break assists with 4. Andrew Fifita has been stifled by injury for most of the season, but he averages more attacking plays per game then any other Prop at 0.67 APPG.

Andrew Fifita is also the king of second phase averaging 7.5 SPPG (Parker second with 4.06 SPPG), including 53 tackle breaks and 37 offloads. He is second in both tackle bust and offloads, behind Martin Taupau with 56 tackle breaks and Corey Parker with 50 offloads. Meat and Potatoes Prop Josh Starling is the least active Prop when it comes to second phase only averaging 0.32 SPPG, including 2 tackle breaks and 4 offloads.

Jesse Bromwich is the biggest metre eater so far in 2014, running 286 timed for 2705 metres at 143 metres per game. James Graham has ran the most hit ups with 297, George Burgess has ran the second most metres with 2426 and Matt Scott has the second best average metres per game, running 139 per game. Sam McKendry runs the least metres per game of all Props on this list, running for just under 80 per game.

Josh McGuire has made more tackles then all other props in 2014 with 632 at 35 a game. Aiden Tolman is the most effective Prop in defence, he has 345 tackles from 350 attempts at 98%. Nate Myles has missed the most tackles with 53, making him the least effective prop on this list. Myles has made 519 tackles from 572 attempts at just over 90%.

The trend of potency in attack leading to a higher error rate continues. Andrew Fifita the best Prop in attack is also the least disciplined making on average 2.08 Errors/Penalties Per Game (EPPG), he has the most errors with 15 and has 11 penalties. JWH is them most penalised Prop in 2014 with 24 to his name. Reformed bad boy Willie Mason is the most disciplined at 0.35 EPPG, including 2 errors and 4 penalties.

Best by the Numbers: Jesse Bromwich (rates high in all areas and has no downsides)

Worst by the Numbers: Nate Myles (surprising, but has high error rate, worst defence, doesn’t average over a hundred metres a game, averages under one second phase play and has not registered a single attacking play in 2014)

For more Rugby League Statistics check out our Facebook page:

https://www.facebook.com/RLStats

2014 Second Row Comparison

Screen Shot 2014-08-05 at 7.54.48 pm

Sonny Bill Williams as you may expect dominated most areas when compared to all other Second Row Forwards. In attack he has the most try assists with 4 and the most line break assists with 11. Simon Mannering has the most tries with 9 and Boyd Cordner leads the line breaks with 9. Ex Five Eighth Wade Graham has registered 4 forced drop outs more then any other Second Rower. SBW averages 1.53 Attacking Plays Per Game (APPG) followed by Dave Taylor (1.22), Boyd Cordner (1.21), Wade Graham (1.16), Simon Mannering (1.16), Matt Gillett (1.13) and Tony William (1.06). No other Second Rower averaged over 1.00 APPG. Elijah Taylor is the worst attacking Second Rower with a poor average of 0.18 APPG.

SBW leads the way in Second Phase Per Game with 4.87 with 37 tackle busts and 36 offloads, ahead of Tony Williams (4.28). No other Second Rower averages over 4.00 SPPG. Jason Taumalolo leads the tackle busts with 56 but he only has registered 5 offloads for the season, this gives him an average of 3.21 SPPG. Ryan Hoffman is the least active Second Rower when it comes to second phase only averaging 0.89 SPPG.

Dave Taylor has ran more metres then any other Second Rower in 2014, with 253 runs for 2394 metres at 133 metres per game. SBW and Jason Taumalolo average the second most metres per game with 117 a piece. Chris McQueen averages the fewest metres at only 60 metres per game.

Tackling machine Elijah Taylor leads the tackle count for Second Rowers with 576 at 33 per game to his name. Leeson Ah Mau is the most effective in defence with 454 tackles from 466 attempts at 97.42% effective. SBW comes in second with 337 tackles from 350 attempts at 96.29% effective. Dave Taylor has spent significant time in the Centres this year and his defence has suffered with a effective percentage of 84.13.

With great attacking ability comes errors and second rowers are no different with SBW leading the Errors/Penalties Per Game (EPPG) stat with 2.00. SBW has 21 errors equal with Wade Graham and 9 penalties. Wade Graham also leads the penalty count with 15. Gun defender Leeson Ah Mau is the most disciplined Second Rower only averaging 0.58 EPPG.

Best by the numbers: SBW

Worst by the numbers: No stand out apparent.

For more Rugby League stats check out our Facebook page:

https://www.facebook.com/RLStats


2014 Lock Comparison

Screen Shot 2014-08-05 at 7.54.44 pm

Corey Parker’s move to the front row has narrowed the competition for the title of the NRL’s best Lock. Paul Gallen and Sam Burgess appear to be the only real contenders for this title. They are easily the most potent in attack,  Burgess leads the tries and line breaks with 7 a piece and Gallen leads line break assists with 6. Gallen averages 1.63 Attacking Plays Per Game (APPG), this is significantly more then Burgess who averages 1.06 APPG. Feleti Mateo leads the try assists with 5 and is a close third in APPG at 1.00. The Warriors Sebastine Ikahihifo is the least potent lock when it comes to attack in 2014 only averaging 0.07 APPG.

Burgess and Gallen also lead all other Locks by some margin in second phase play. Sam has registered 53 tackle busts and 43 offloads in 2014. The next closest Lock has 16 less tackle busts and 14 less offloads. Gallen has only played 8 games in 2014 so he has significantly less game time then Burgess, however he averages more Second Phase Per Game (SPPG), averaging 6.38 to Sam’s 5.33. Glen Hall with only 7 tackle bust and 4 offloads is worst second phase lock in 2014. This only gives him an average of 0.61 SPPG.

Burgess and Gallen comfortably average the most metres per game, averaging a staggering 163 and 164 metres respectively. Trent Merrin comes in third at 150 metres per game. Sam Burgess has ran 365 times for 2936 metres. This is over 100 carries and 500 metres more then any other Lock. Ryan Hinchcliffe averaging 48 metres a game is the least active running lock this season.

Work Horse Shaun Fensom has racked up 730 tackles in 2014, 130 more then Sam Burgess and Ryan Hinchcliffe who have each made 597. Shaun averages over 40 tackles a game and has only missed 21 all season. This makes him 97.20% effective in defence. Only Glenn Hall has a better percentage with 97.55, however he averages 23 less tackles a game then Fensom. Only Greg Bird (87.34%) and Adam Docker (89.41%) are less then 90% effective in defence.

When it comes to discipline Sam Burgess is easily the worst offender with the most penalties (15) and errors (22). This gives him an average of 2.06 Errors/Penalties Per Game (EPPG) Greg Bird is nipping at his heals at 1.86 EPPG. Greg Eastwood with 3 penalties and 2 errors is the most disciplined Lock, averaging on 0.33 EPPG.

Best by the numbers: Paul Gallen, just gets over the top of Sam due to his poor discipline.

Worst by the numbers: Adam Docker, average in all areas of the game.

For more Rugby League Statistics check out our Facebook page

https://www.facebook.com/RLStats

Reliance on the spine.


Some claim the “Spine” (1,6,7,9) of a football team is the key to a premiership, others would argue that forwards, and defence win games. I would say its a combination of all, as well as a special team cohesion not shown by the numbers. For example Manly sit on top of the ladder, with the 4th most attacking plays, 9th most metres, and the 10th best defensive percentage. Compared to the Cowboys who sit 12th, with the 5th most attacking plays, 3rd most metres, and the 3nd best defensive percentage. If it was purely mathematical, Manly would not would not be in such a lofty position. Moving on.

The purpose of this article is to rank a teams reliance on their spine in attack. My method which was basic, and only focusing on the statistics available, was to add up all the Tries, Try Assists, Line Breaks, Line Break Assists, Forced Drop Outs, and 40/20s that have been notched up by a teams Fullback, Five Eighth, Halfback, and Hooker (including interchange Hooker). I would then divide this figure by the number of games played by the team to receive a number. This numbers represents the average number of “attacking plays per game” a spine had produced. I would then do the same for the entire team to get a total team “attacking plays per game”. I then used these two figures to calculate what percentage of attacking plays the teams spine had performed of the total. For example the Cowboys relied on their spine for 57.95% of the total attacking plays while the Roosters only relied on their spine for 41.87% of the total.

The problem with this method is that I have not factored in injuries during the game, and swapping of position, such as the Roosters routinely do with their Fullbacks. This effective should be minimal as Anthony Minichiello and RTS have only have a difference on 3 attacking plays, so hopefully it evens out.

The teams are listed below from highest reliance on the spine to lowest. I have also added in a number of other figures, for comparison. Its hard to know if such statistics have any use. Sometimes they confirm exactly what you want them to. For example the Bulldog’s spine have the 14th most attacking plays, and the team has the 12th most, which is not spectacular for a team coming 3rd, but they have the most metres by far, and the second best defensive percentage. These figures seem to confirm that the Bulldogs success belongs to their Forward pack and not their spine. However such numbers do not take into account the Hooker’s control of the ruck, or the Halves direction during play. Which are huge factors in winning football games. Other times stats make no sense at all. The Cowboys for example tick every statistical box of a top eight team, and yet they sit outside the top eight. Perhaps it is over reliance on their spine. I am not sure.


1. Cowboys (57.95%)                                                                                  Screen Shot 2014-07-14 at 5.46.40 pm

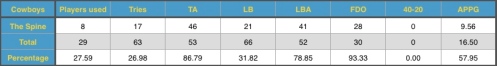
Pos 12th, 7 wins, 9 losses.

1st in spine attacking plays.

5th in total attacking plays.

All run metres 23751 (3rd)

Defensive percentage 92.81 (2nd)

The Cowboys have used 8 players in their spine out of a total of 29 total in 2014.


2. Storm (55.73%)

Screen Shot 2014-07-16 at 9.40.32 am

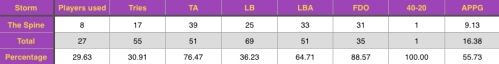
Pos 8th, 8 wins, 8 losses.

2nd in spine attacking plays.

6th in total attacking plays.

All run metres 23389 (7th)

Defensive percentage 91.99 (7th)

The storm have used 8 players in their spine out of a total of 27 total in 2014.


3. Panthers (55.42%)

Screen Shot 2014-07-16 at 9.40.49 am

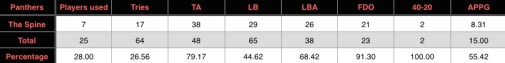
Pos 2nd, 11 wins, 5 losses.

4th in spine attacking plays.

10th in total attacking plays.

All run metres 23798 (2nd)

Defensive percentage 90.58 (12th)

The Panthers have used 7 players in their spine out of a total of 25 total in 2014.


4. Tigers (54.29%)

Screen Shot 2014-07-16 at 9.40.43 am

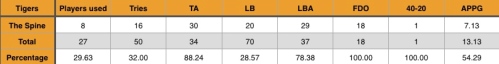
Pos 10th, 8 wins, 8 losses.

10th* in spine attacking plays.

14th in total attacking plays.

All run metres 22726 (13th)

Defensive percentage 89.87 (16th)

The Tigers have used 8 players in their spine out of 27 total in 2014.


5. Raiders (53.44%)

Screen Shot 2014-07-16 at 9.40.25 am

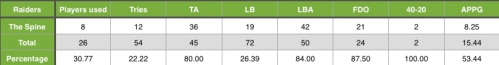
Pos 15th, 5 wins, 11 losses.

5th in spine attacking plays.

9th in total attacking plays.

All run metres 22115 (16th)

Defensive percentage 91.71 (8th)

The Raiders have used 8 players in their spine out of 26 total in 2014.


6. Sharks (53.18%)

Screen Shot 2014-07-16 at 9.40.27 am

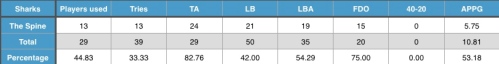
Pos 16th, 4 wins, 12 losses.

15th in spine attacking plays.

15th in total attacking plays.

All run metres 22214 (15th)

Defensive percentage 92.33 (5th)

The Sharks have used 13 players in their spine out of 29 total in 2014.


7. Rabbitohs (50.20%)

Screen Shot 2014-07-14 at 6.39.35 pm

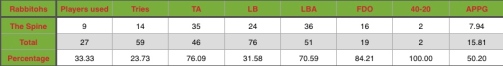
Pos 4th, 9 wins, 7 losses.

8th in spine attacking plays.

7th in total attacking plays.

All run metres 22994 (10th)

Defensive percentage 94.19 (1st)

The Rabbitohs have used 9 players in their spine out of 27 total in 2014.


8. Knights (50.00%)

Screen Shot 2014-07-16 at 9.49.04 am

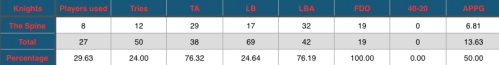
Pos 14th, 5 wins, 11 losses.

13th in spine attacking plays.

13th in total attacking plays.

All run metres 23486 (6th)

Defensive percentage 90.42 (13th)

The Knights have used 8 players in their spine out of 27 total in 2014.


9. Titans (48.21)

Screen Shot 2014-07-16 at 9.40.46 am

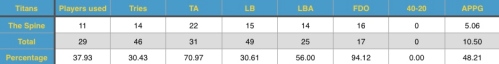
Pos 13th, 7 wins, 9 losses.

16th in spine attacking plays.

16th in total attacking plays.

All run metres 22855 (12th)

Defensive percentage 90.42 (15th)

The Titans have used 11 players in their spine out of 29 total in 2014.


10. Dragons (47.88%)

Screen Shot 2014-07-14 at 6.31.14 pm

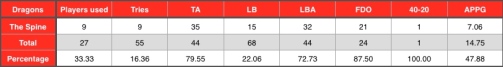
Pos 9th, 8 wins, 8 losses.

12th in spine attacking plays.

11th in total attacking plays.

All run metres 22954 (11th)

Defensive percentage 92.58 (4th)

The Dragons have used 9 players in their spine out of 27 total in 2014.


11. Sea Eagles (46.43%)

Screen Shot 2014-07-16 at 9.40.29 am

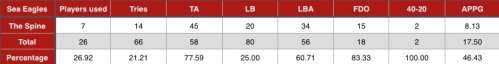
Pos 1st, 11 wins, 5 losses.

6th in spine attacking plays.

4th in total attacking plays.

All run metres 23071 (9th)

Defensive percentage 91.65 (10th)

The Sea Eagles have used 7 players in their spine out of 26 total in 2014.


12. Warriors (45.66%)

Screen Shot 2014-07-16 at 9.40.36 am

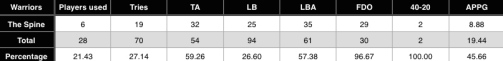
Pos 6th, 9 wins, 7 losses.

3rd in spine attacking plays.

1st in total attacking plays.

All run metres 23638 (5th)

Defensive percentage 91.50 (11th)

The Warriors have used 6 players in their spine out of 28 total in 2014.


13. Eels (45.55%)

Screen Shot 2014-07-16 at 9.48.56 am

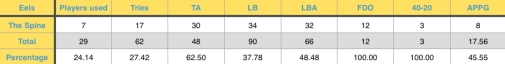
Pos 11th, 8 wins, 8 losses.

7th in spine attacking plays.

3rd in total attacking plays.

All run metres 22610 (14th)

Defensive percentage 90.39 (14th)

The Eels have used 7 players in their spine out of 29 total in 2014.


14. Broncos (45.24%)

Screen Shot 2014-07-16 at 9.40.21 am

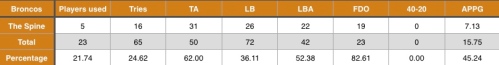
Pos 7th, 8 wins, 8 losses.

10th* in spine attacking plays.

8th in total attacking plays.

All run metres 23671 (4th)

Defensive percentage 91.66 (9th)

The Broncos have used 5 players in their spine out of 25 total in 2014.


15. Bulldogs (42.73%)

Screen Shot 2014-07-16 at 9.40.53 am

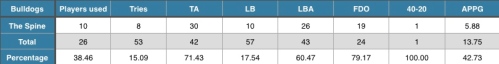
Pos 3rd, 11 wins, 5 losses.

14th in spine attacking plays.

12th in total attacking plays.

All run metres 25007 (1st)

Defensive percentage 92.92 (2nd)

The Bulldogs have used 10 players in their spine out of 26 total in 2014.


16. Roosters (41.87%)

Screen Shot 2014-07-16 at 9.48.59 am

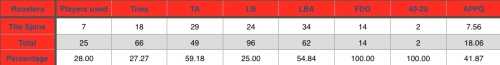
Pos 5th, 9 wins, 7 losses.

9th in spine attacking plays.

2nd in total attacking plays.

All run metres 23230 (8th)

Defensive percentage 92.08 (6th)

The Roosters have used 7 players in their spine out of 25 total in 2014.


If nothing else all these numbers provide interesting talking points.

For more Stats check out. http://www.facebook.com/rlstats/


2014 Five Eight Comparison

Screen Shot 2014-07-11 at 2.36.03 pm

There is no surprise who the dominant Five Eight so far in 2014. Jonathan Thurston has been in superb form and is currently leading the Dally M with Ben Hunt. Thurston leads all other Five Eights in Tries (6), Try Assists (20), Line Breaks (8), and Line Break Assists (15). Thurston is second in Forced drop out with 12, behind Jamie Soward with 13. Soward also leads the 40/20s with 2. Thurston averages 4.36 Attacking Plays Per Game (APPG). To indicate how far ahead Thurston is in attack, no other Five Eight averages over 3.00 APPG. The next best is Jamie Soward (2.93), Josh Reynolds (2.92) and Chad Townsend (2.77). Maurice Blair and Braith Anasta are the worst attacking Five Eights in 2014 averaging 0.82 and 0.85 APPG respectively.

Corey Norman has broken more tackles then any other Five Eight in 2014 with 35. Josh Hoffman (33), and Gareth Widdop (30), are the only other Five Eights to break over 30 tackles. John Sutton and Josh Reynolds lead the way with Offloads, with 18 and 16 respectively. Blake Austin has been the busiest second phase Five Eight in the comp. He averages 3.10 SPPG. No other Five Eight averages over 3.00 SPPG. The next best is Josh Reynolds with 2.92 SPPG. Michael Dobson has the worst strike rate when it comes to second phase plays only averaging 0.50 SPPG.

Josh Hoffman and John Sutton are the only Five Eights to run for over a thousand metres in 2014. Hoffman has recorded 1289 and Sutton 1265. Hoffman leads the Metres Per Game at 85.92, Sutton coming in second at 75.06 MPG. No other Five Eight averages over 70 MPG. Michael Dobson is the laziest running Five Eight only averaging 17.50 MPG.

John Sutton leads in every area of defence. He has made 315 tackles. He is the only Five Eight with 300 plus tackles to his name. He averages more tackles then any other Five Eight at 19.69 per game. Sutton is also the most effective defending Five Eight, at 92.38%. Blake Austin (91.62%) Fa’amanu Brown (90.54%), and Corey Norman (90.44%) are the only Five Eights to average over 90% in defence. Todd Carney is the least effective defending Five Eight in 2014, at 78.34%.

In 15 games Jamie Soward has only made 3 errors and 3 penalties, giving him a superb average of 0.40 Errors/Penalties Per Game (EPPG), the best of any Five Eight. James Maloney is by far the worst offender in matters of discipline. He has the most errors and penalties, with 23 and 12 respectively, at an average of 2.19 EPPG.

Best Attacking Five Eight: Johnathan Thurston,

Most Consistant: Johnathan Thurston,

Worst Five Eight: Michael Dobson.

Johnathan Thurston is to good what else is there to say.


For more stats check out.

http://www.facebook.com/rlstats/


2014 Halfback Comparison

2014 Halfback comparison up to RND 17.


After 17 rounds of competition few would have predicted Ben Hunt to be the dominant Halfback in the competition. He currently leads the Dally M and is the dominant attacking number 7 in the competition. He leads all other Halfbacks in Tries (7), Try Assists (17), and Line Breaks (14). He is second in Line Break Assists (11) and third in Forced Drop Outs (11). He averages 4.00 Attacking Plays Per Game (APPG), followed by Copper Cronk (3.60), Benji Marshall  (3.14), Mitchell Pearce (3.13), and Shaun Johnson (3.07). No other Halfback averages over 3.00. Daniel Holdsworth has proved to be the worst attacking Halfback in the competition, averaging only 0.71 APPG. He is the only Halfback to average below 1.00.

Shaun Johnson has broken more tackles then any other Halfback this year with 39 to his name. He leads Ben Hunt with 35, Albert Kelly equal with Adam Reynolds on 31 and Luke Brooks with 30. No other Halfback has broken over 30 tackles so far this year. DCE and Robert Lui are the only Halfbacks with over 20 Offloads to their name so far in 2014 with 23 apiece. DCE is the leading second phase Halfback, averaging 3.64 SPPG. DCE leads a close following pack consisting of Robert Lui (3.27), Shaun Johnson (3.20) and Ben Hunt (3.07). No other number 7s average over 3.00 SPPG. Daniel Holdsworth again sits alone at the bottom when it comes to second phase averaging only 0.29 SPPG.

Albert Kelly leads the way in Runs (101), Metres (1178), and Metres Per Game (84.14). Shaun Johnson is the only other Halfback to have cracked a thousand metres this year and to average over 60 metres per game. Johnson has ran for 1049 metres at 69.93 MPG. Daniel Holdsworth makes it 3 from 3 at the wrong end of the scale. He has ran for a pathetic 13.57 MPG in 2014.

Adam Reynolds has made more tackles then any other Halfback in 2014 with an even 300 to his name. Josh McCrone sits second with 292, and Ben Hunt third with 272. DCE is the most effective defending Halfback with a percentage of 92.61. He is hotly pursued by Adam Reynolds (92.59%), Cooper Cronk (91.67%), Josh McCrone (90.97%), and Jeff Ronson (90.53%). No other Halfback averages above 90%. Rookie 19 year old Luke Brooks has opened up a gap of 20 missed tackles to the nearest offender. He has missed 76 tackles so far in 2014. All these missed tackles has left him only 69.11% effective in defence. Brooks is the only Halfback to average less them 75% in defence.

In 7 appearances Jack Littlejohn has only made one error and conceded no penalties, giving him and outstanding average of 0.14 Errors/Penalties Per Game (EPPG). Only Littlejohn along with Jeff Robson (0.70), Tyrone Roberts (0.93), and Shaun Johnson (0.93) average less then 1.00 EPPG. Benji Marshall 2014 comeback tour has yielded more errors per game then any other Halfback at 2.29 EPPG. No other Halfback averages over 2.00 EPPG.

Best Attacking Halfback: Ben Hunt,

Most Consistant Halfback: Ben Hunt,

Worst Halfback: Daniel Holdsworth.

A special mention to Shaun Johnson along with Ben Hunt who each average over 3 APPG, 3 SPPG, over 50 MPG, defend above 85% and only average around 1 EPPG.

If Ben Hunt goes only to win the Dally M in 2014 it would cap of an incredible coming of age for Hunt. He will have finally proved his potential in the top grade after he was heralded as the next big thing way back in 2008, when he won the NYC inaugural player of the year in 2008.

For more stats check out.

http://www.facebook.com/rlstats/