
Speculation over who will replace Jarryd Hayne in the Blues line up started the moment he made the decision to switch to the NFL. Early popular opinion had Penrith young gun Matt Moylan in the hot seat. Last week NSW coach Laurie Daley named Josh Dugan, Brett Stewart & Matt Moylan as the main contenders for the Blues custodian role. With only 5 rounds down and 5 to go before the team is announced for the May 27 opener, debate is sure to heat up.
The purpose of this article is to compare purely with statistics Jarryd Hayne’s form after the first 5 rounds in 2014, with: The Blues main Fullback contenders, longshots and the likely Maroon fullbacks. This article will only look at some key areas based on simple statistics that are readily available to the public. It in no way tells the whole story, but should provide some good early season talking points.
Attack 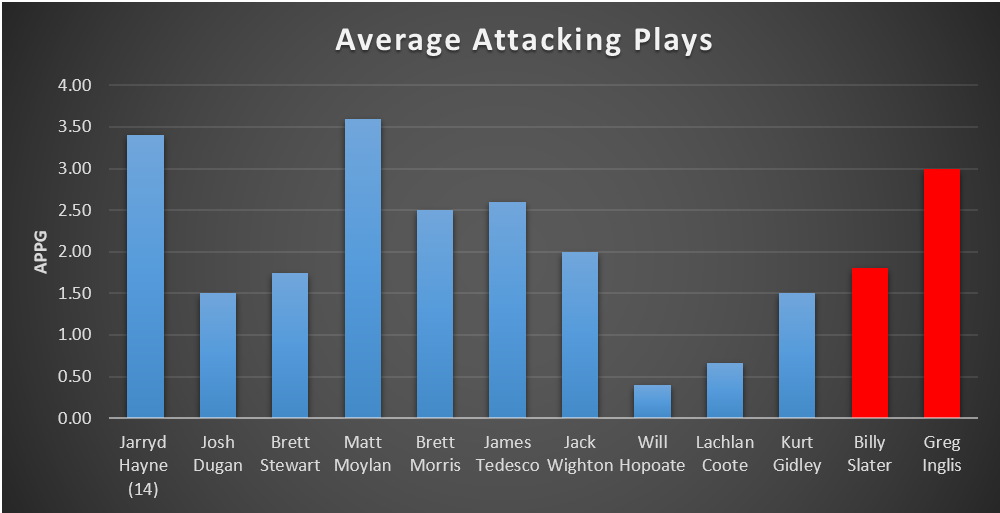 [Attacking Plays Per Game (APPG) = the sum of: Tries, Try Assists, Line Breaks, Line Break Assists, Forced Drop Outs & Forty Twenties; divided by games played. Stats sourced from Fox Sports.]
Matt Moylan has been the most potent attacking Fullback on our list after 5 rounds, averaging 3.6 attacking plays; which is slightly higher than Hayne at the same time last year who averaged 3.4. Moylan comfortably leads this list in try and line break assists with 7 and 6 respectively. James Tedesco has recorded the most tries with 5 and Brett Morris who has been ruled out of Origin this year with a hamstring injury, leads line breaks with 7. Will Hopoate in his new role, has been the least potent Fullback in attack; averaging only 0.4 attacking plays. As a matter of perspective, in form Fullbacks average over 2 attacking play per game and the best average 3 plus. For example Hayne, Slater & Inglis averaged 4.2, 3.0 & 2.4 respectively, during the 2014 regular season.
Run Metres
 [Total run metres divided by games played. Stats sourced from Fox Sports.]
What Will Hopoate lacks in attack he makes up for in work ethic; averaging 162 metre per game; the most of all Fullbacks in this list. Hopoate is closely followed by Jack Wighton and Brett Morris with 157 and 153 metres respectively. Hayne averaged 135 at the same time last year; however, he finished the season averaging 178. Brett Stewart has only managed 69 metres per game so far in 2015; 20 fewer than his 2014 average. Stewart is managing less metres then journeyman Kurt Gidley who has returned to the custodian role.
Second Phase
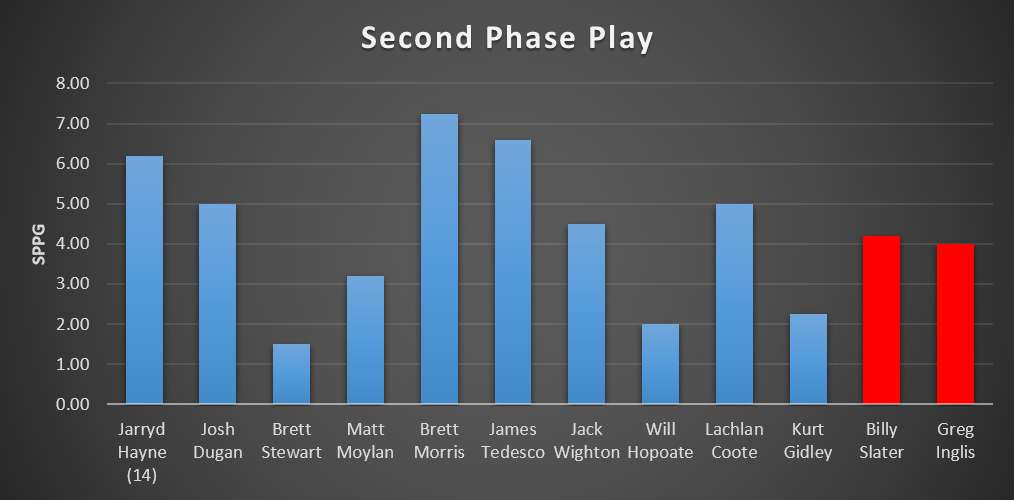 [Second Phase Per Game (SPPG) = sum of: Offloads & Tackle Busts divided by games played. Stats sourced from Fox Sports.]
Brett Morris and James Tedesco lead the way in second phase plays so far in 2015 with 7.3 and 6.6 per game respectively. Tedesco has broken the most tackles with 30 and Morris has the most offloads at 6. Josh Dugan and Lachlan Coote have also proved difficult to tackle; averaging 5 a piece. Brett Stewart sits at the bottom in this area; a direct reflection of his run metres. He has only managed 1.5 per game; with a total of 3 tackle busts and 3 offloads. Hayne averaged 6.2 per game after 5 rounds; finishing the season averaging over 7. Greg Inglis and Billy Slater are both down in these areas compared to last year; both averaged close to 5 at the end of the 2014 regular season.
Defence
 [Total tackles divided by attempted tackles, displayed as percentage. Stats sourced from Fox Sports.]
Kurt Gidley at 98% effective in defence is technically the best defensive Fullback so far in 2015; however, his numbers have been greatly inflated, due to not exclusively playing Fullback. Gidley has already made more tackles then most fullbacks over the course of the 2014 season. For this reason we will exclude him. Josh Dugan at 92% and Will Hopoate at 91% are the best ‘true’ defensive Fullbacks in this list. Greg Inglis at 78% is well down on last year where he defended at 90%; the best of all any Fullback. Inglis only needs to miss more tackle to equal last year’s total. Matt Moylan is the worst of the contenders at 69% effective, down from 80% in 2014. Hayne only managed to be 71% effective throughout the 2014 season which was well down on his career average of 80%. This statistic provides the least insight in my opinion for Fullbacks, because they make so few tackles. It struggles to be truly representative of their defensive ability.
Errors and Penalties
 [Errors & Penalties Per Game = the sum of: Errors & Penalties, divided by games played. Stats sourced from Sports Mate League Live.]
Josh Dugan and Jack Wighton have been the least disciplined in 2015 averaging 2.3 errors and penalties. Moylan, Tedesco and Wighton have each produced 8 errors; Dugan, Moylan and Hopoate have each conceded 2 penalties. Hayne averaged 1.2 at this point last season, but finished the season averaging 2.0. Greg Inglis continues to be one of the most disciplined fullbacks; only producing 0.4 per errors & penalties per game; slightly better than 2014 where he averaged 0.71.
The season is young and the debate will continue to rage; the potentials mentioned above still have plenty of time to step up, and show the selectors they have what it takes to succeed in Rugby League’s toughest contest. As I am only a fan of stats and not a statistician, it is hard to know what, if anything these simple comparisons mean; however, it is always nice to throw some numbers around in a debate.
